Introduction
This weekend, I was reviewing logs on my web server and noticed dozens of failed login attempts, as expected, of course, with anything exposed to the internet. Here's a quick snippet of the failed authentications I saw:
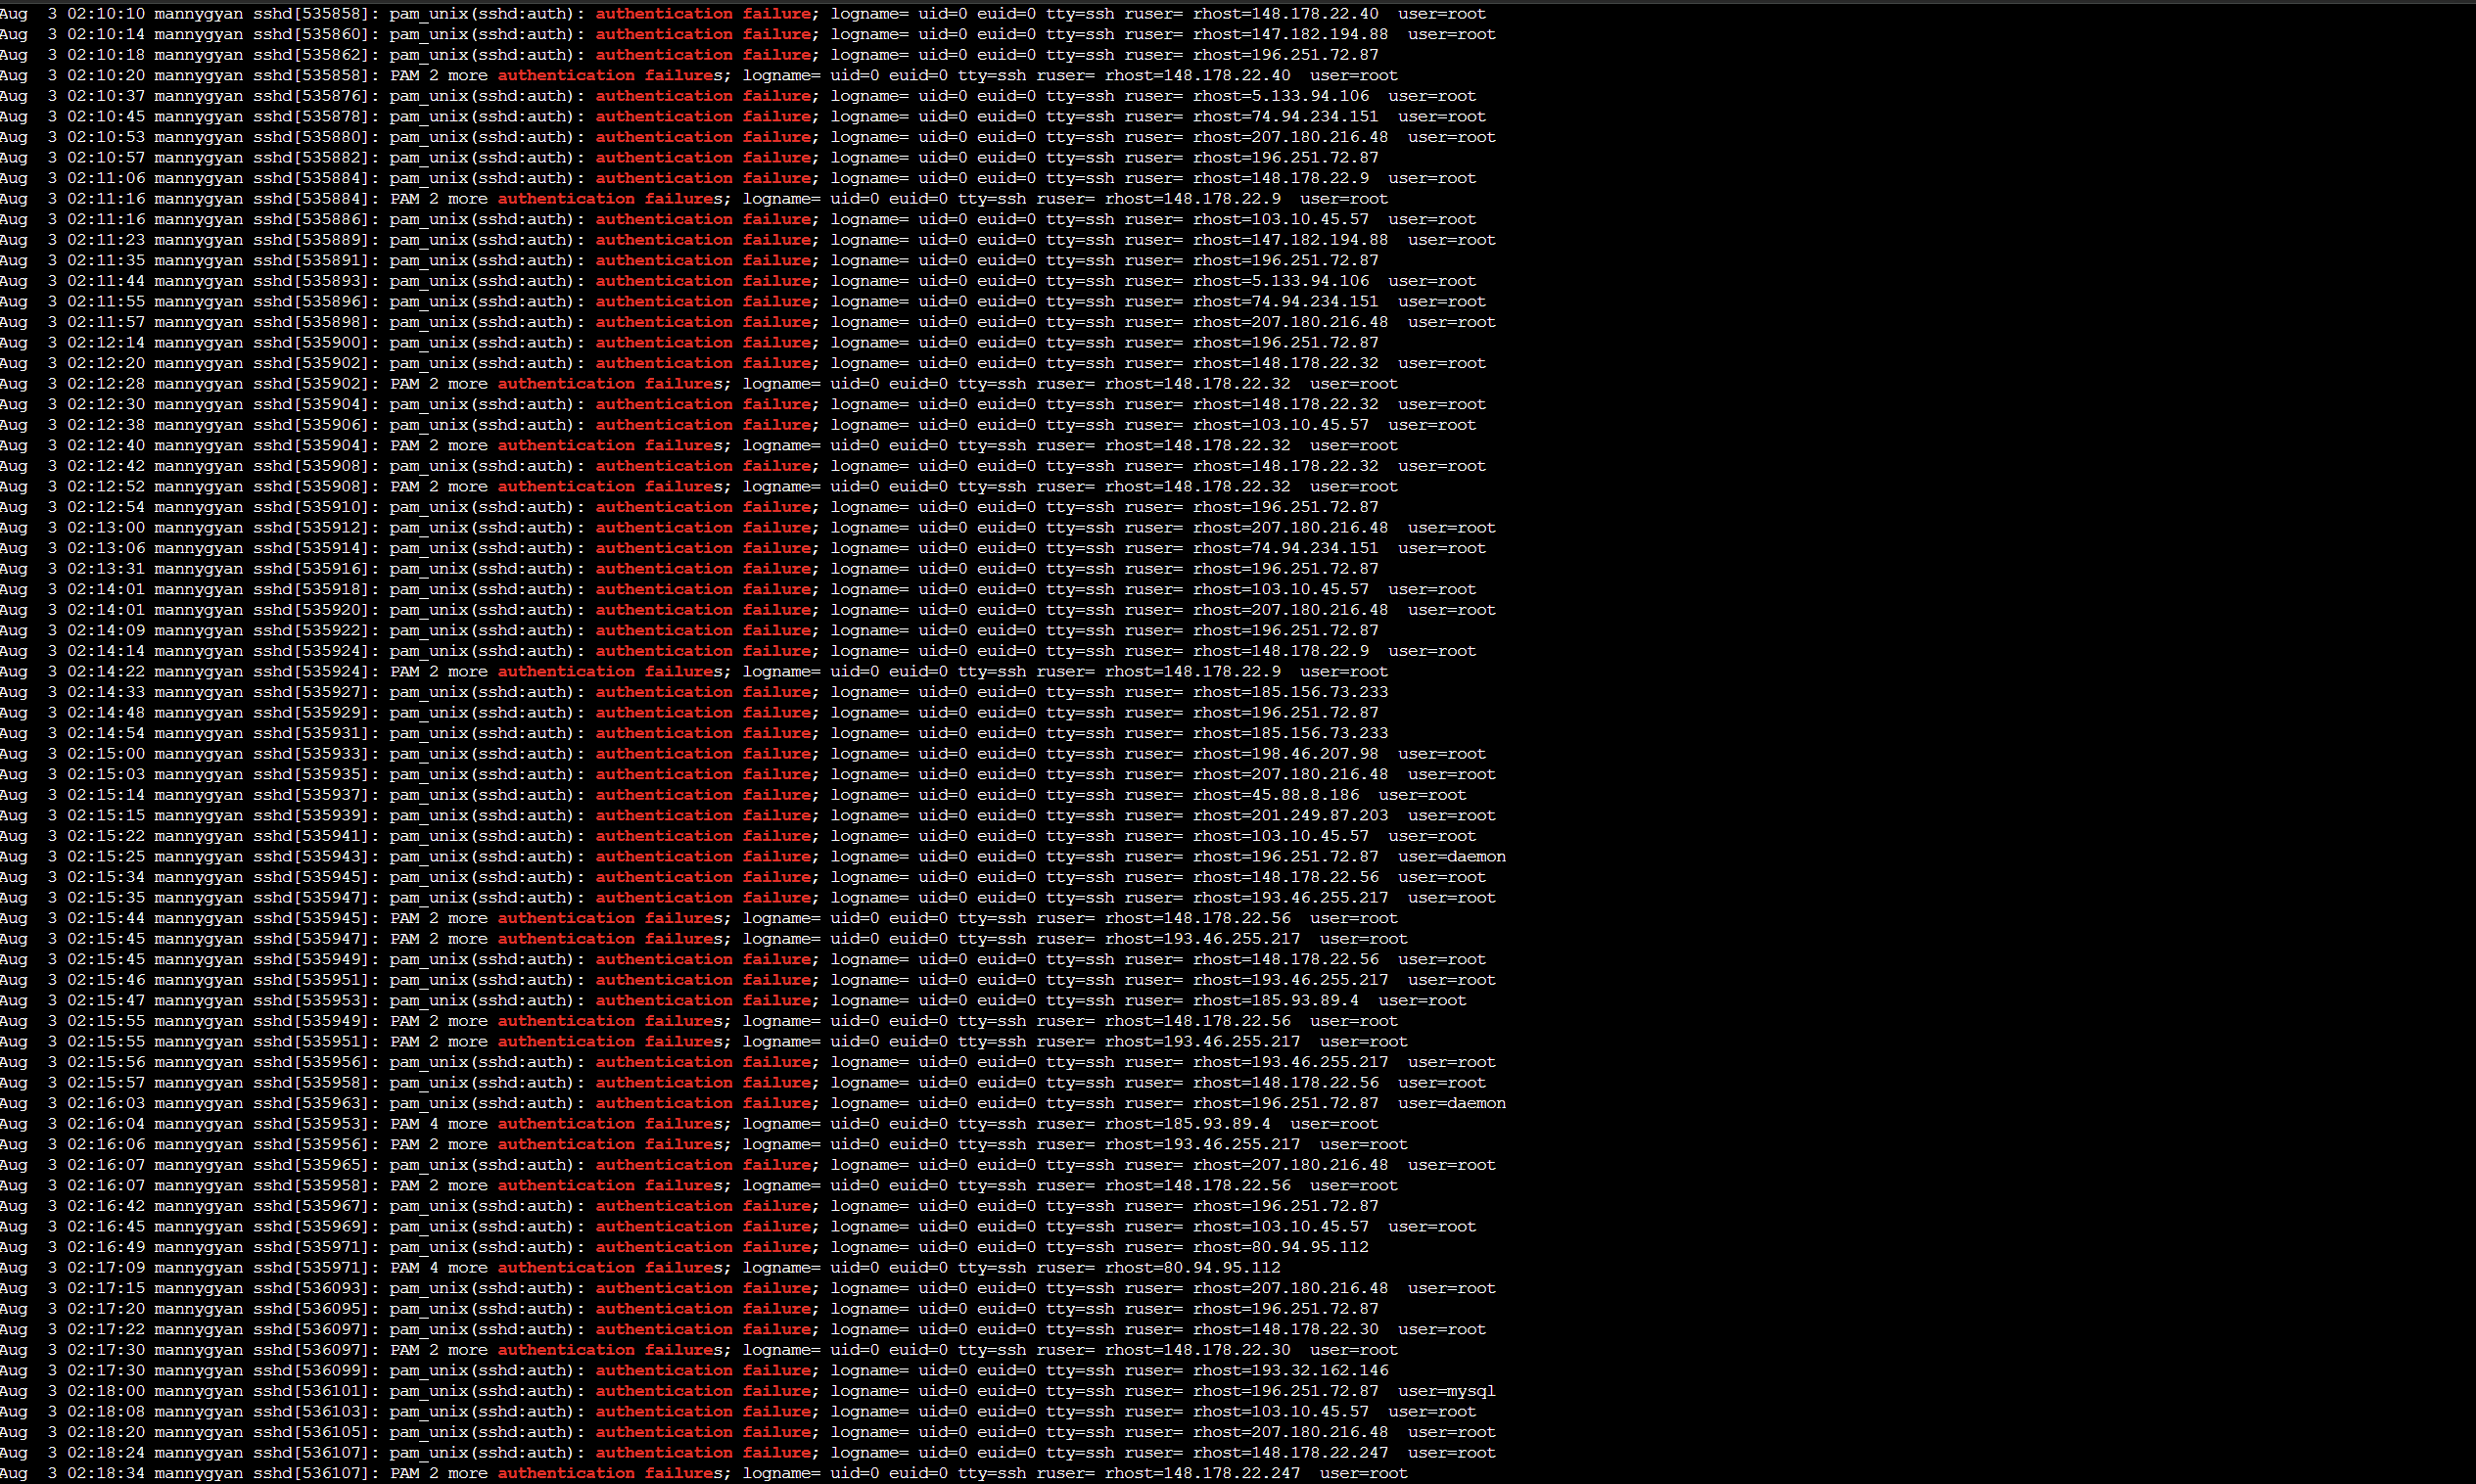
So I thought , why not deploy a honeypot?
For those unfamiliar, honeypots are decoy systems or services designed to lure attackers, detect and study their methods. The goal for this project was to:
- Observe malicious behavior in real time
- Visualize global attacks
- Understand offensive tooling from a defensive perspective
This post walks through the full setup, from VPS provisioning to real-time dashboards via T-Pot and Elastic Stack.
Resources
Provisioning the VPS on Vultr
I started by deploying a VPS using Vultr. I chose Vultr because they give a 90-day free trial when you sign up, this made the deployment of no cost to me. For this project, I selected a shared CPU instance located in New Jersey and installed Ubuntu 22.04 LTS x64. It is recommended to get the Cloud Compute with 160 GB SSD as that is the storage needed according to Vultr documentation.
Specs:
- vCPU: 4 cores
- RAM: 8 GB
- Storage: 160 GB SSD
- Backups: Disabled (optional)
- Public IPv4: Enabled
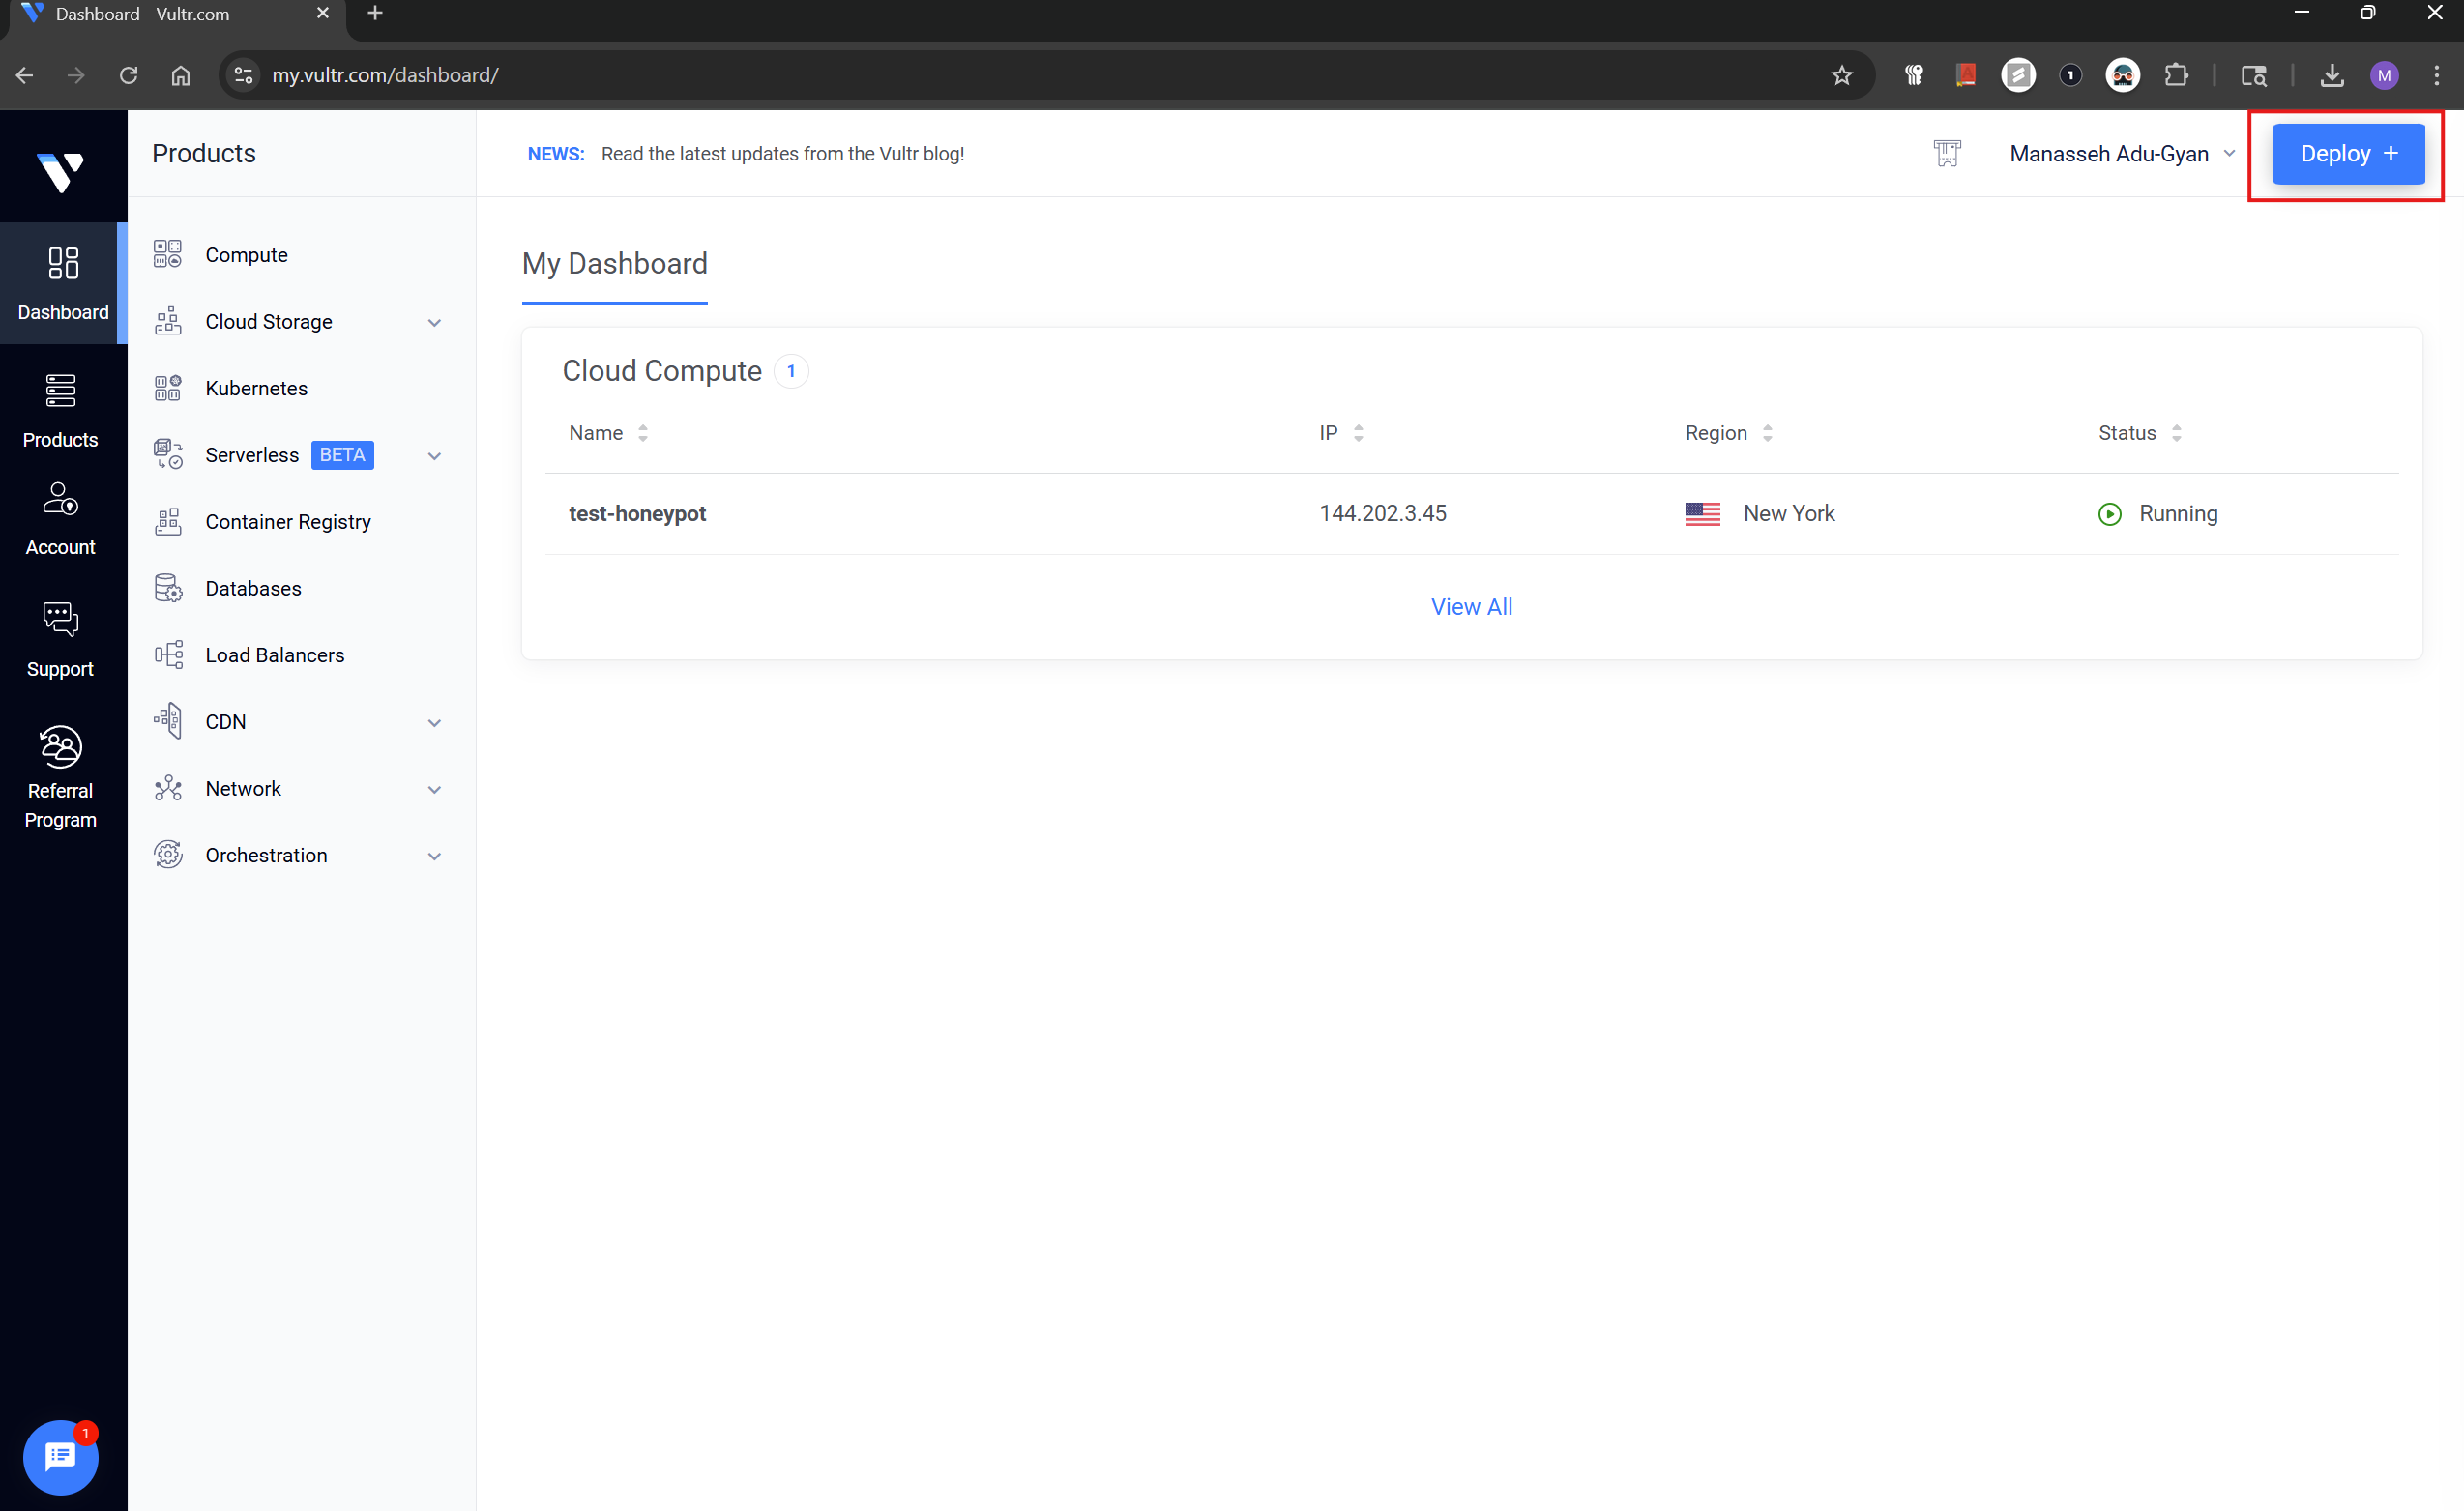
The first step, from the Vultr dashboard, click Deploy and choose Deploy New Server from the drop-down.
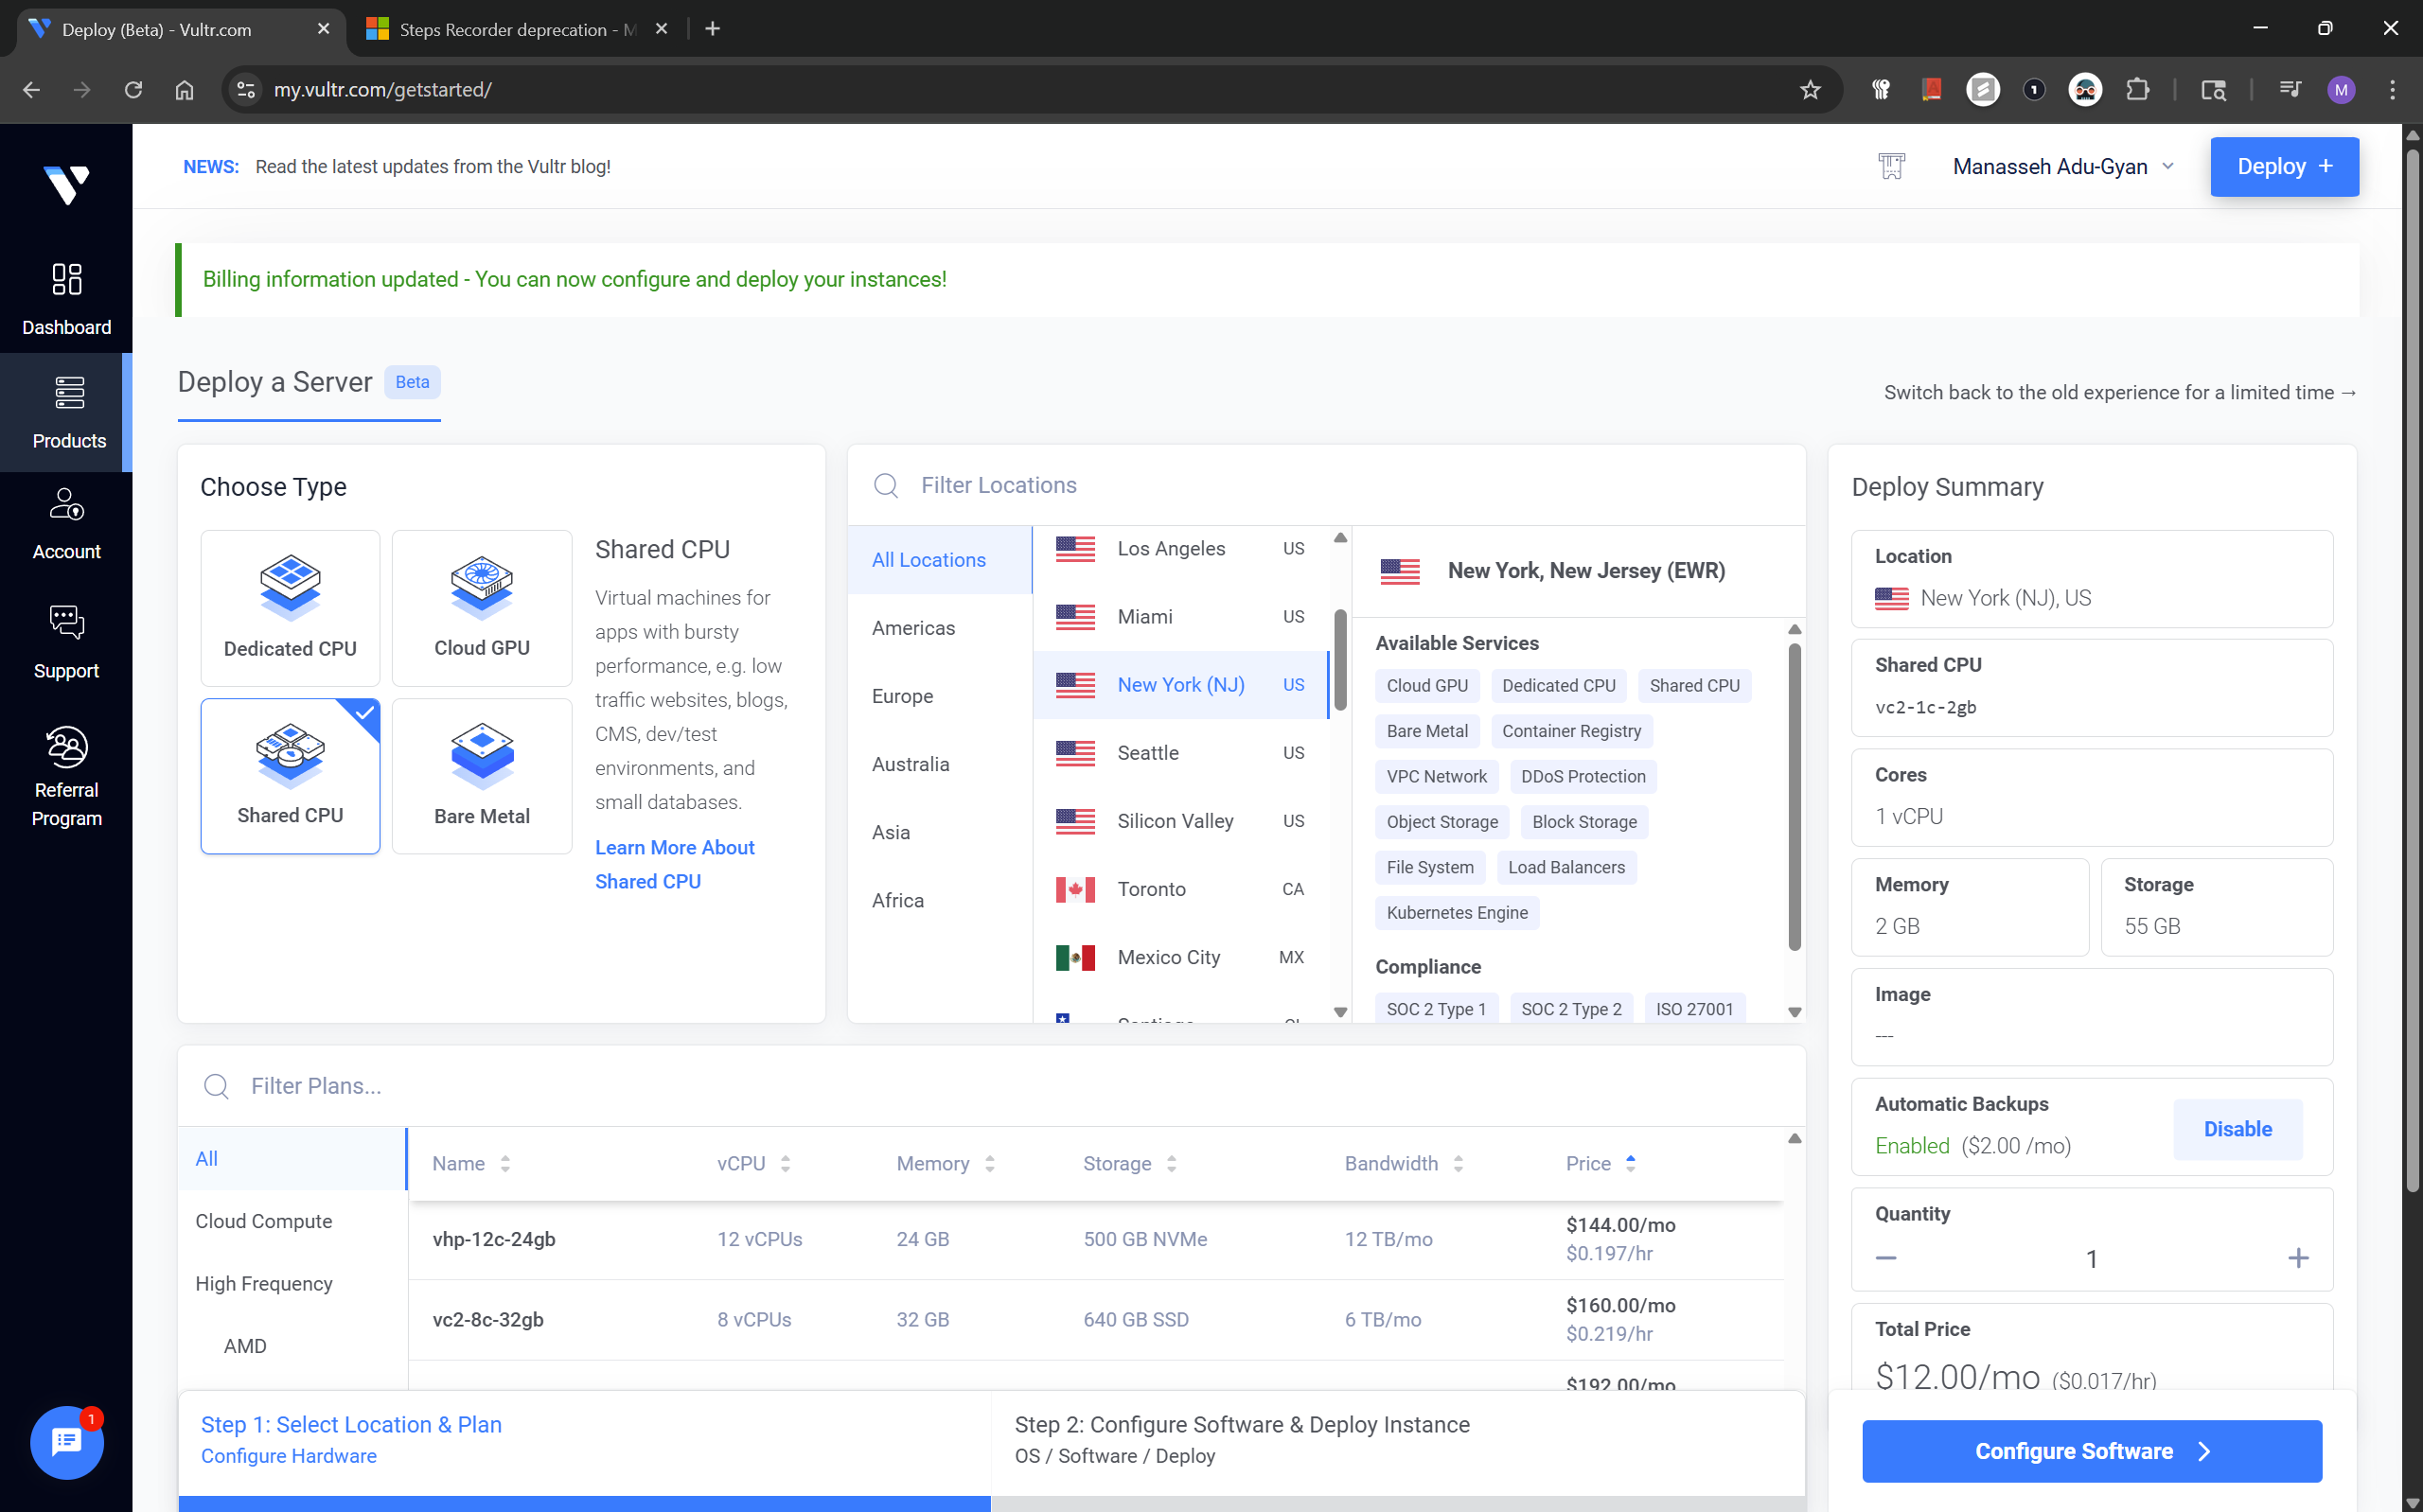
On the next screen, for the type we choose Shared CPU and location(preferential).
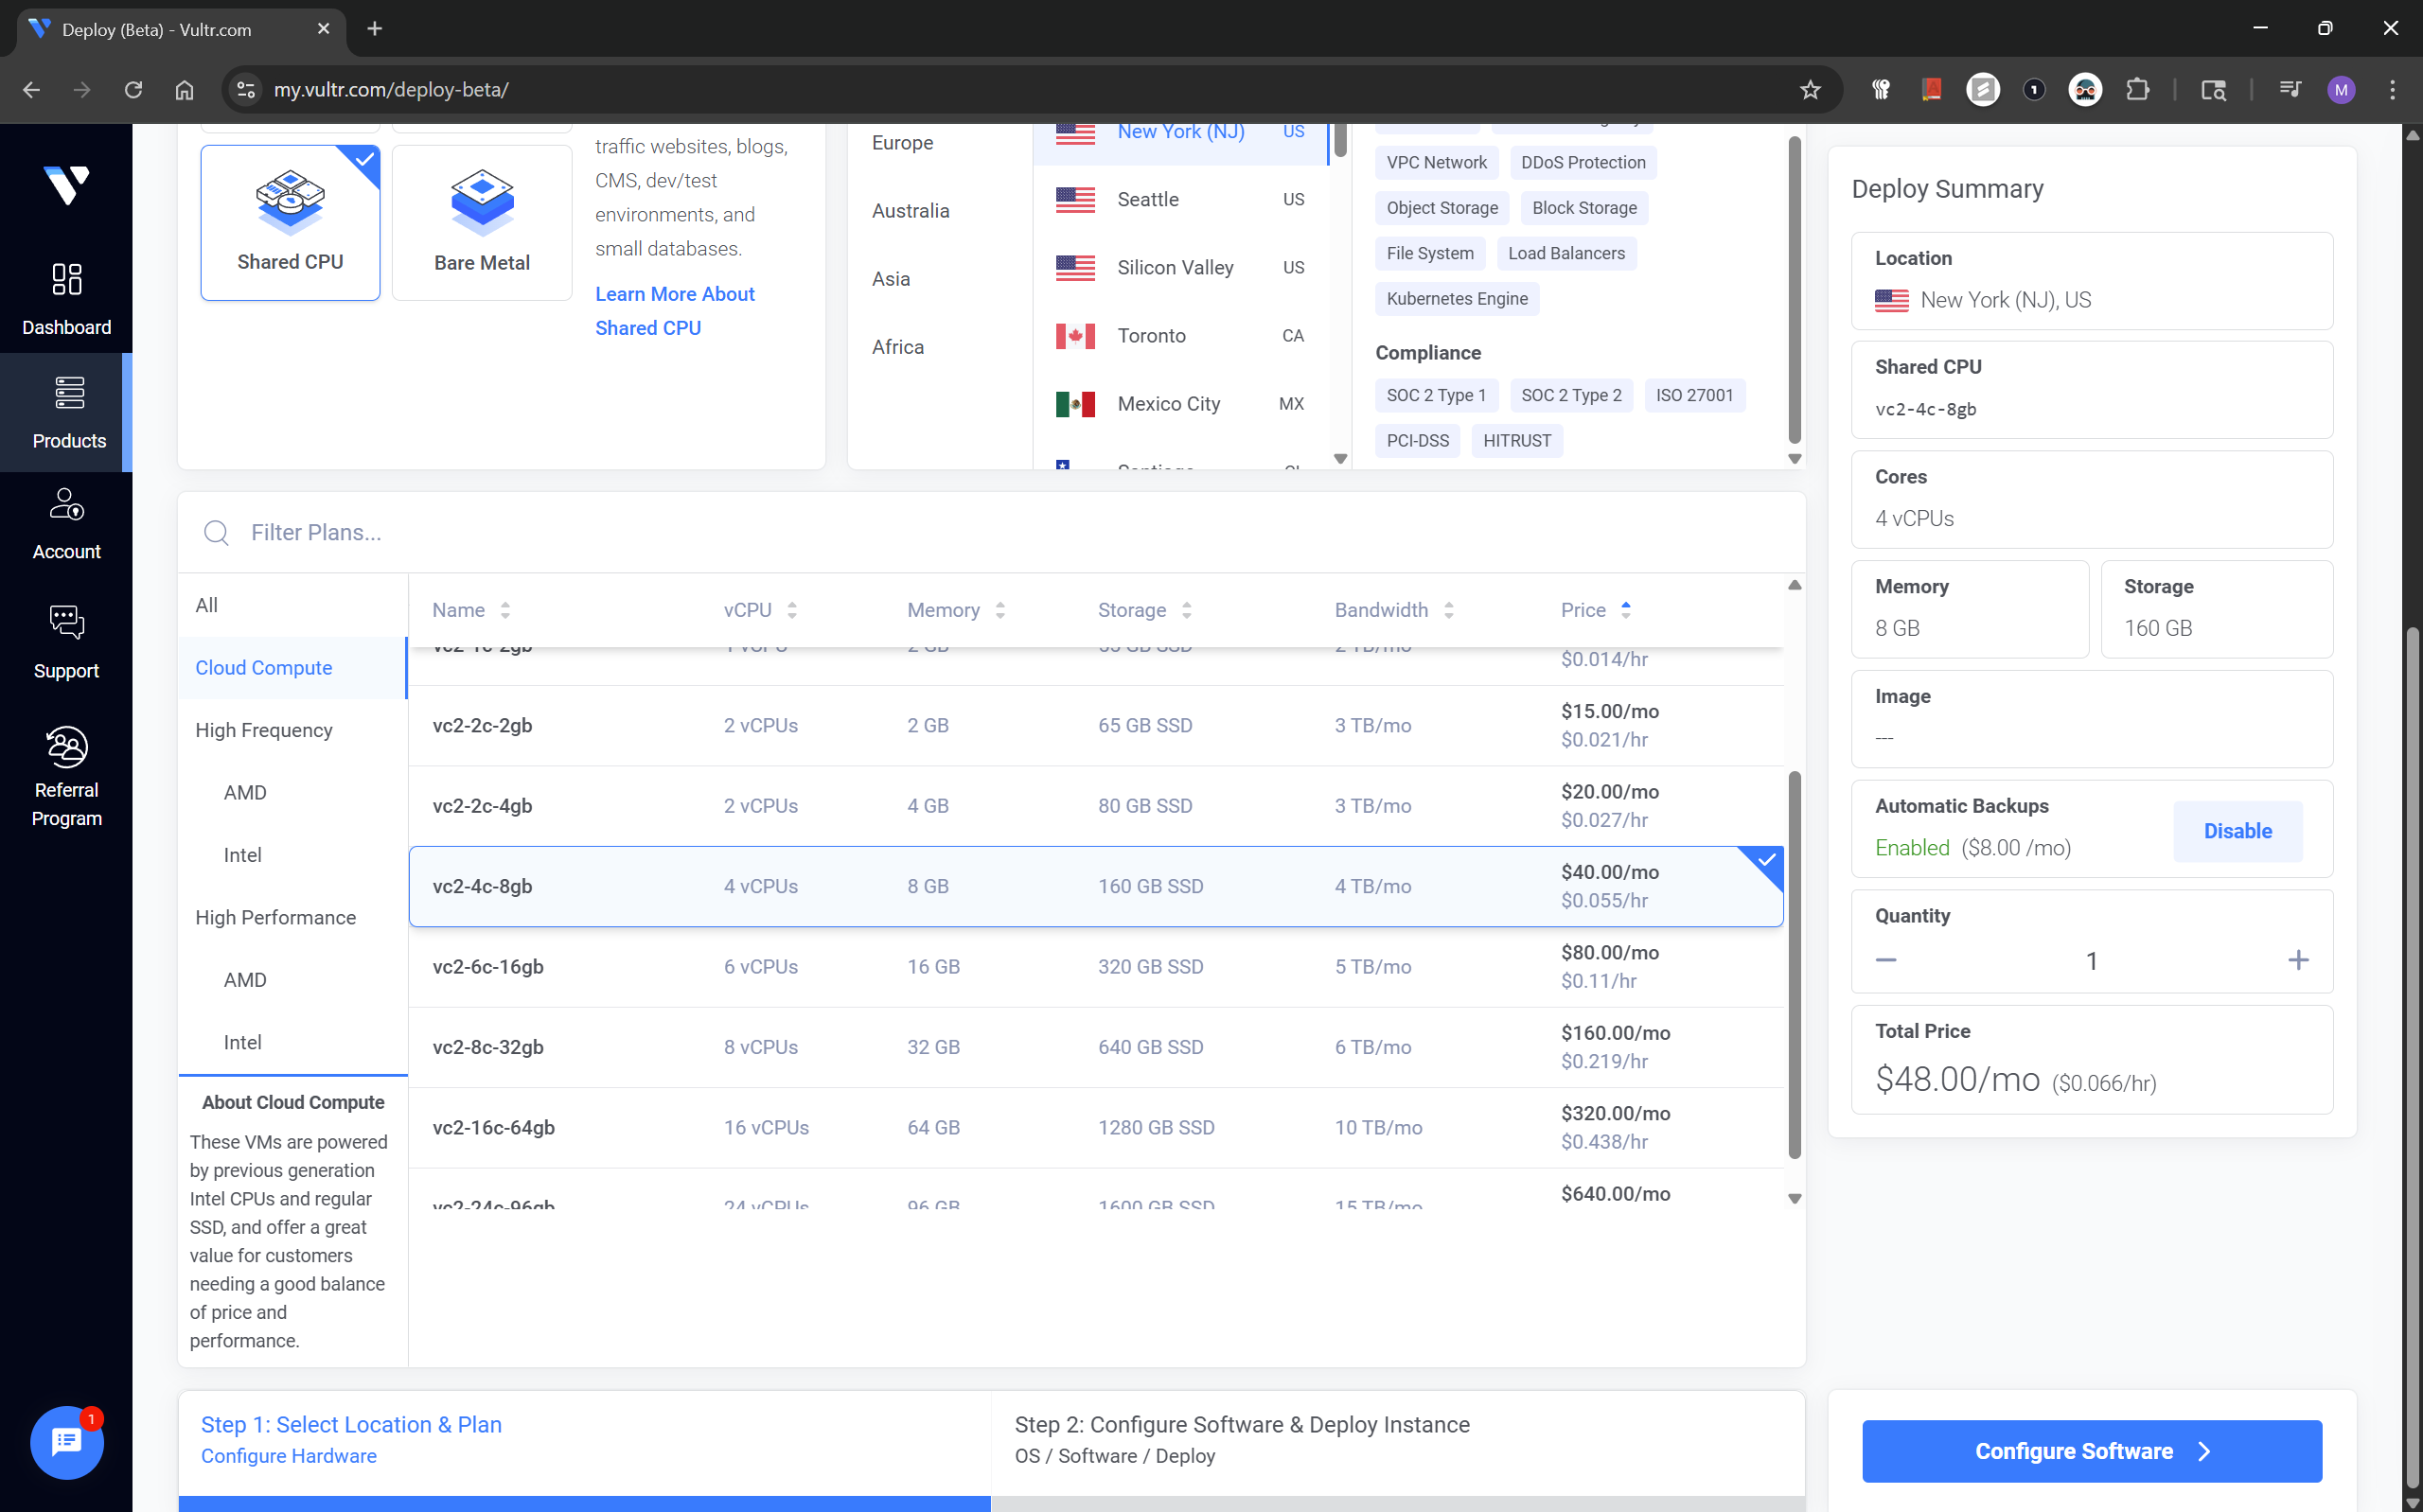
For the plans , it is recommended to choose the Cloud Compute with 160 GB SSD.
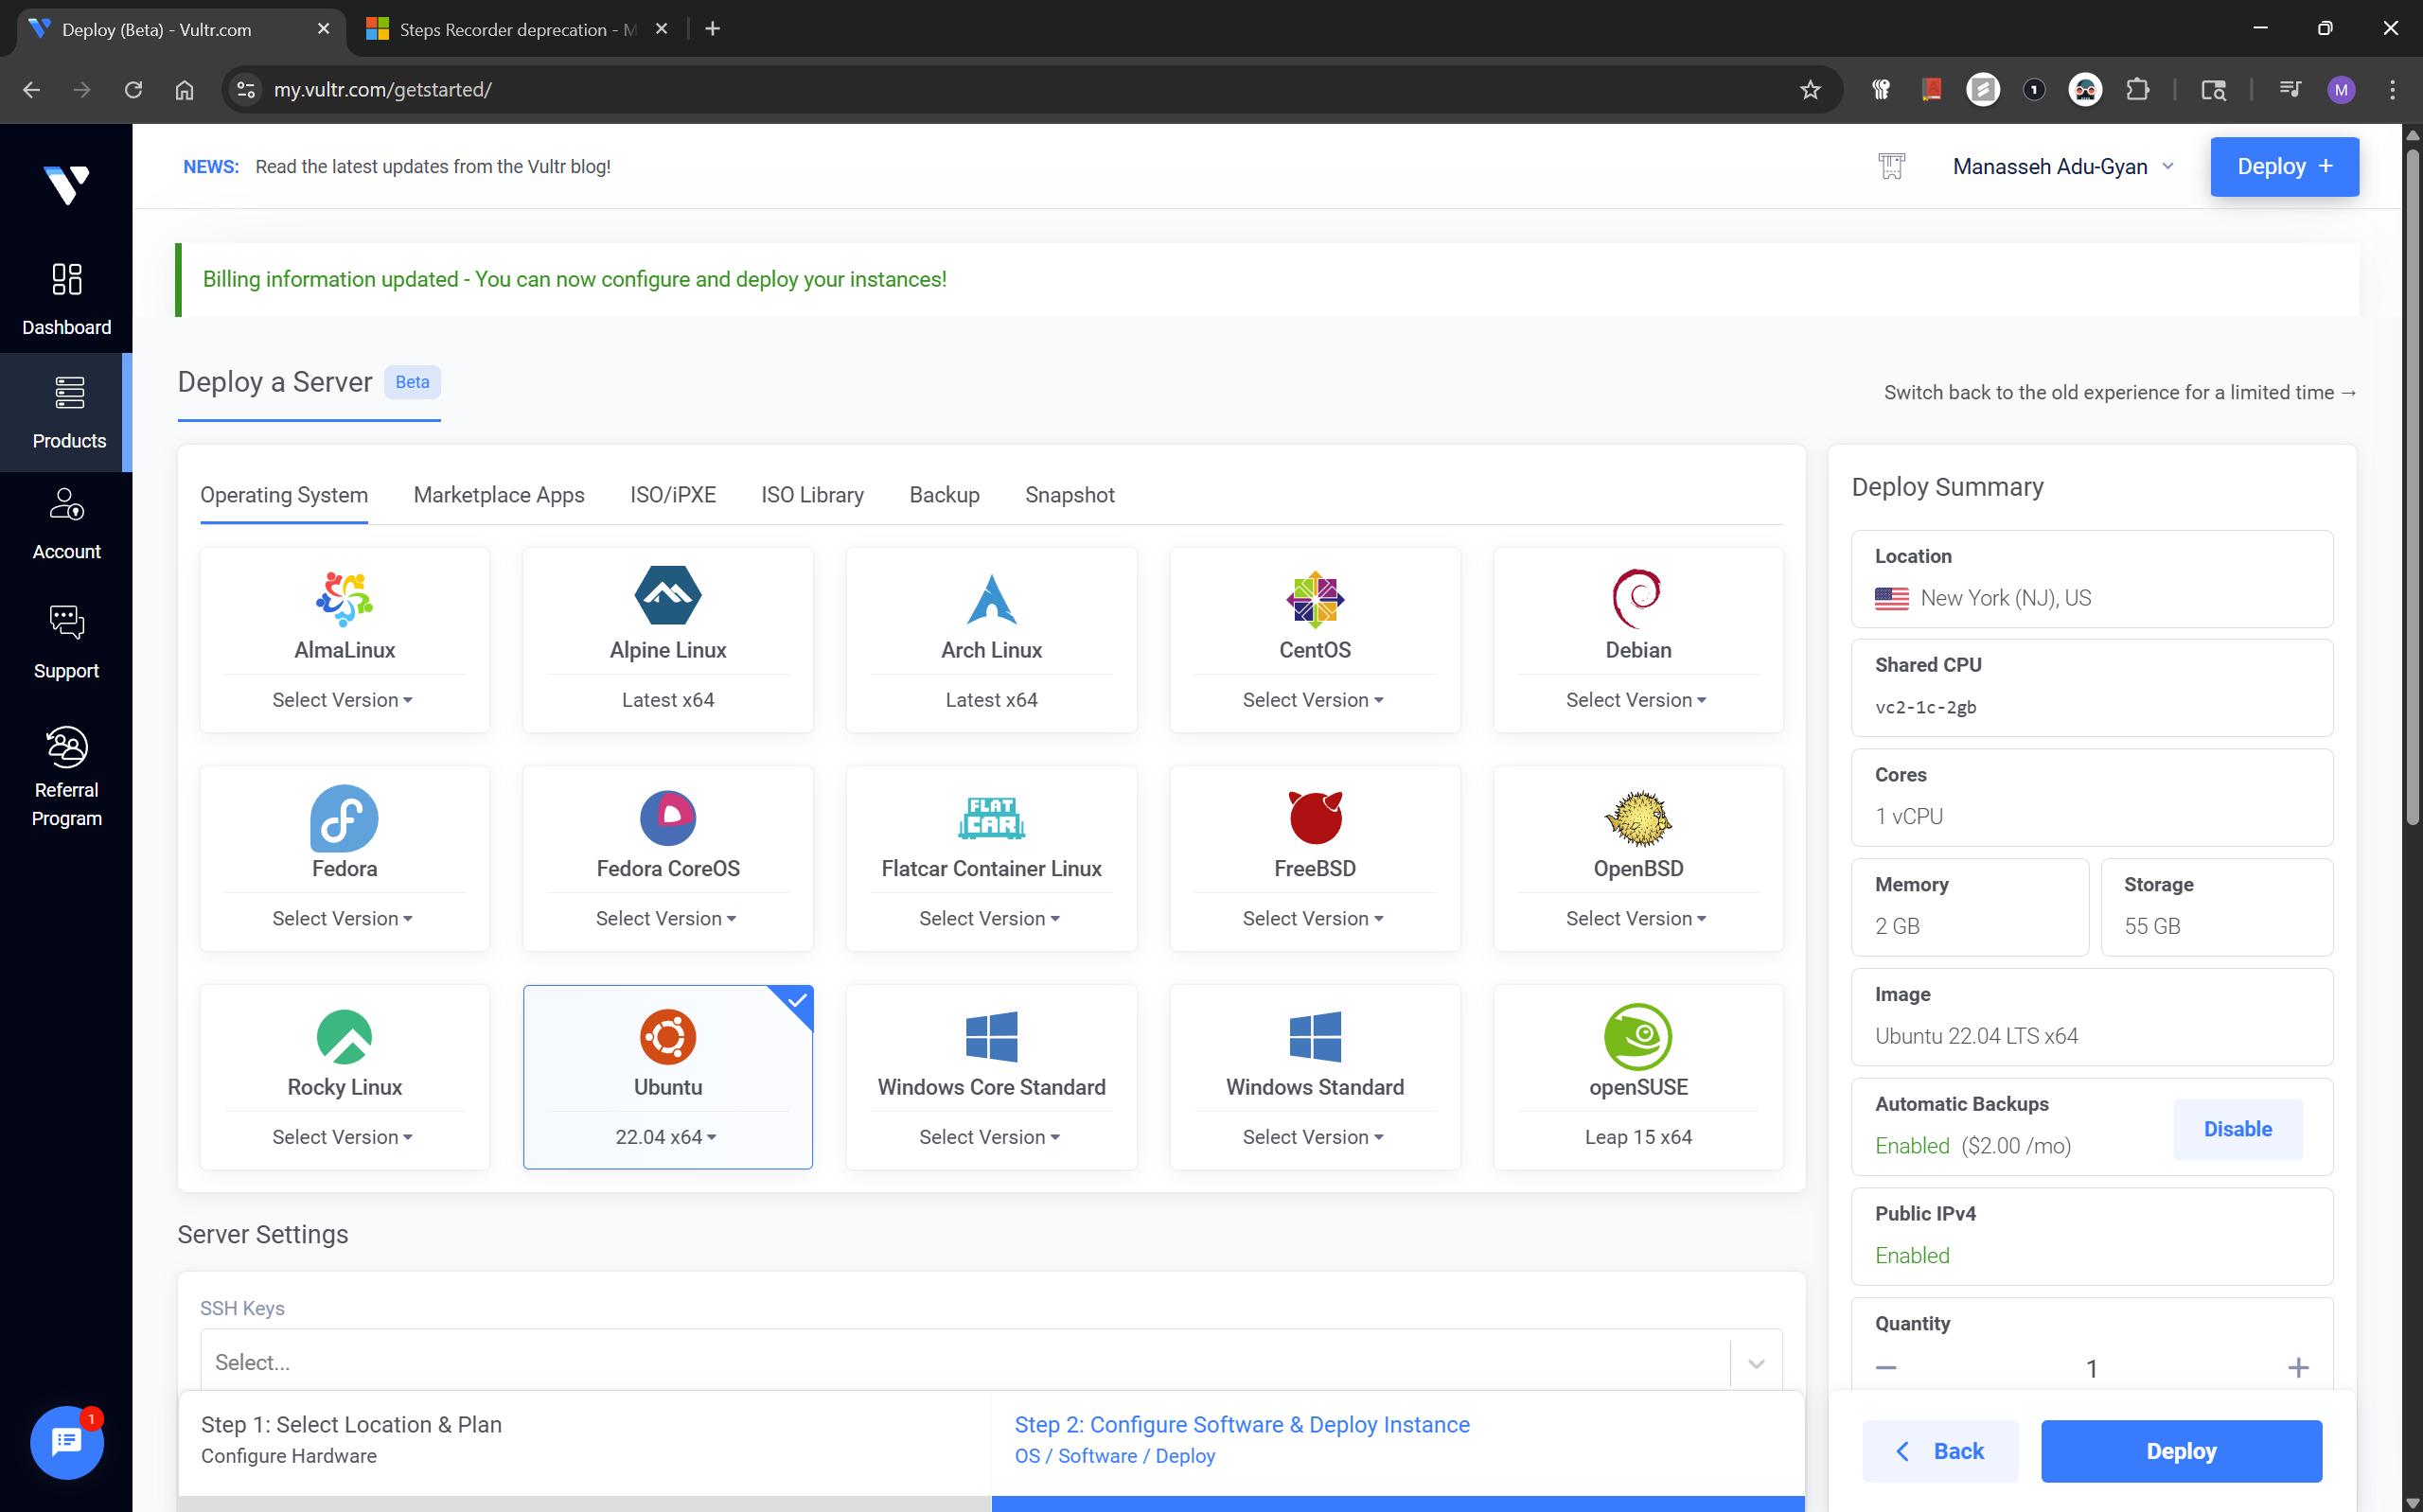
After the previous step, click configure software, choose Ubuntu 22.04 x64.
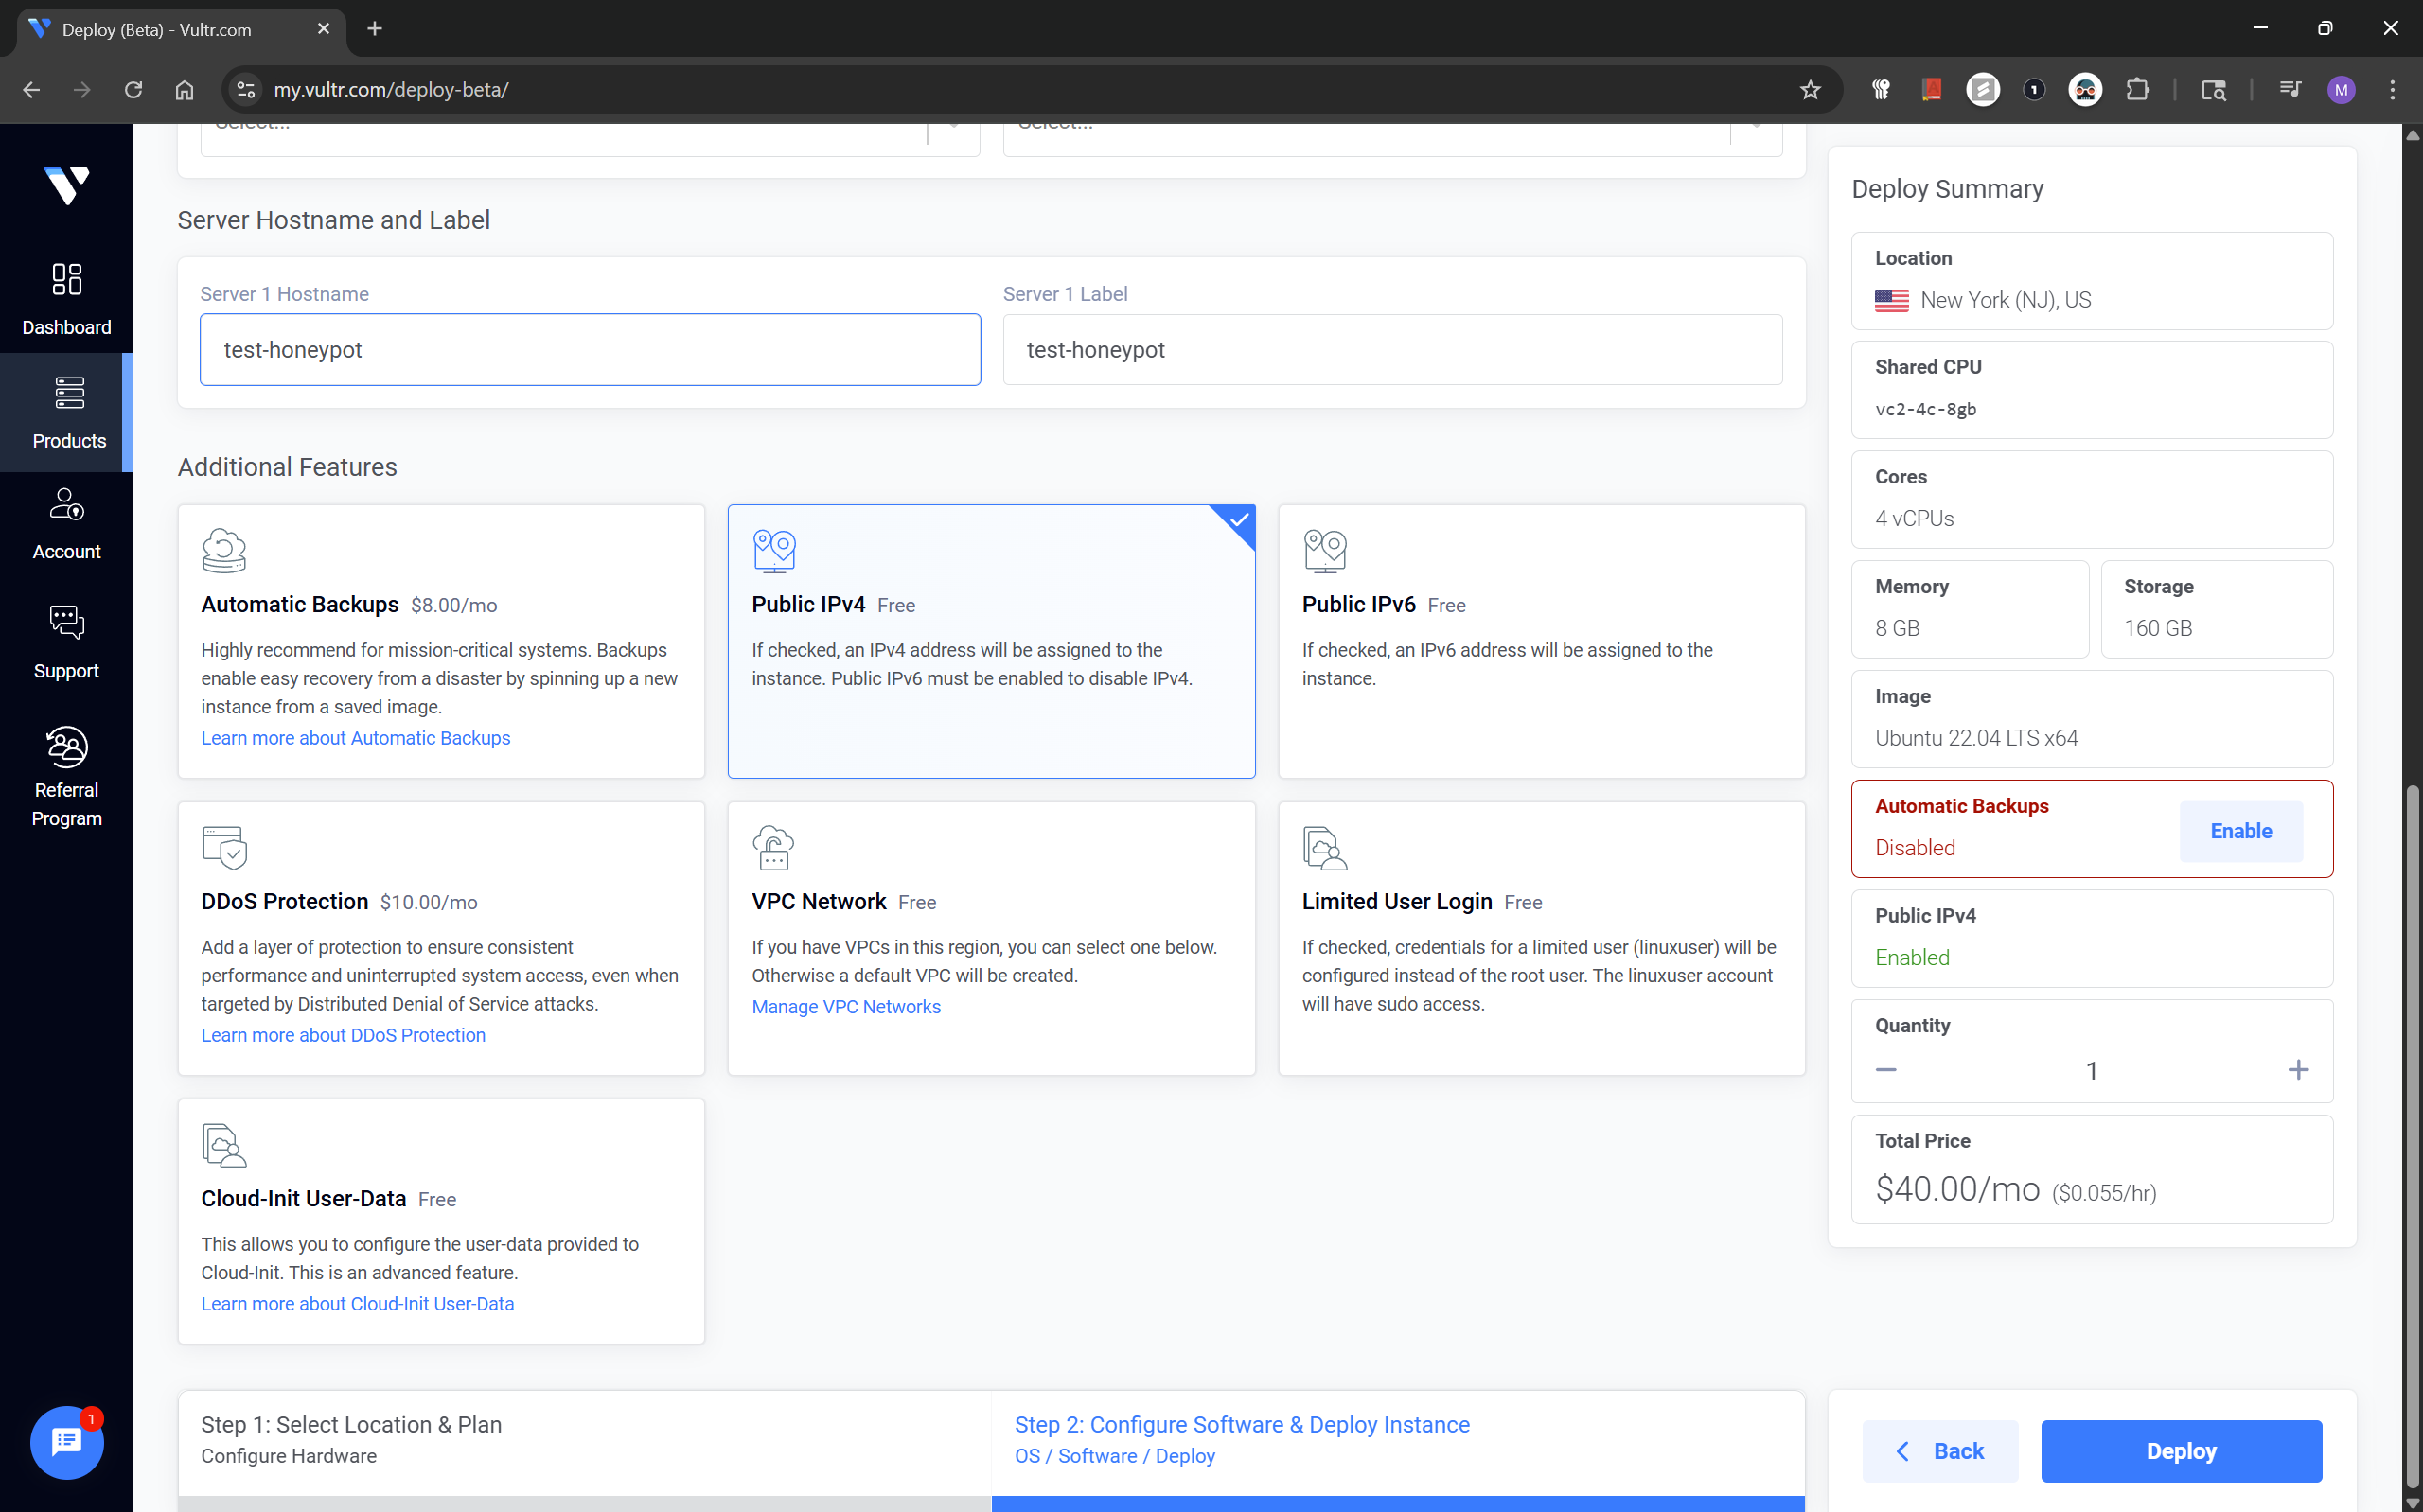
I disabled Automatic Backups as I didn't feel the need, also make sure Public IPv4 is enabled in the options.
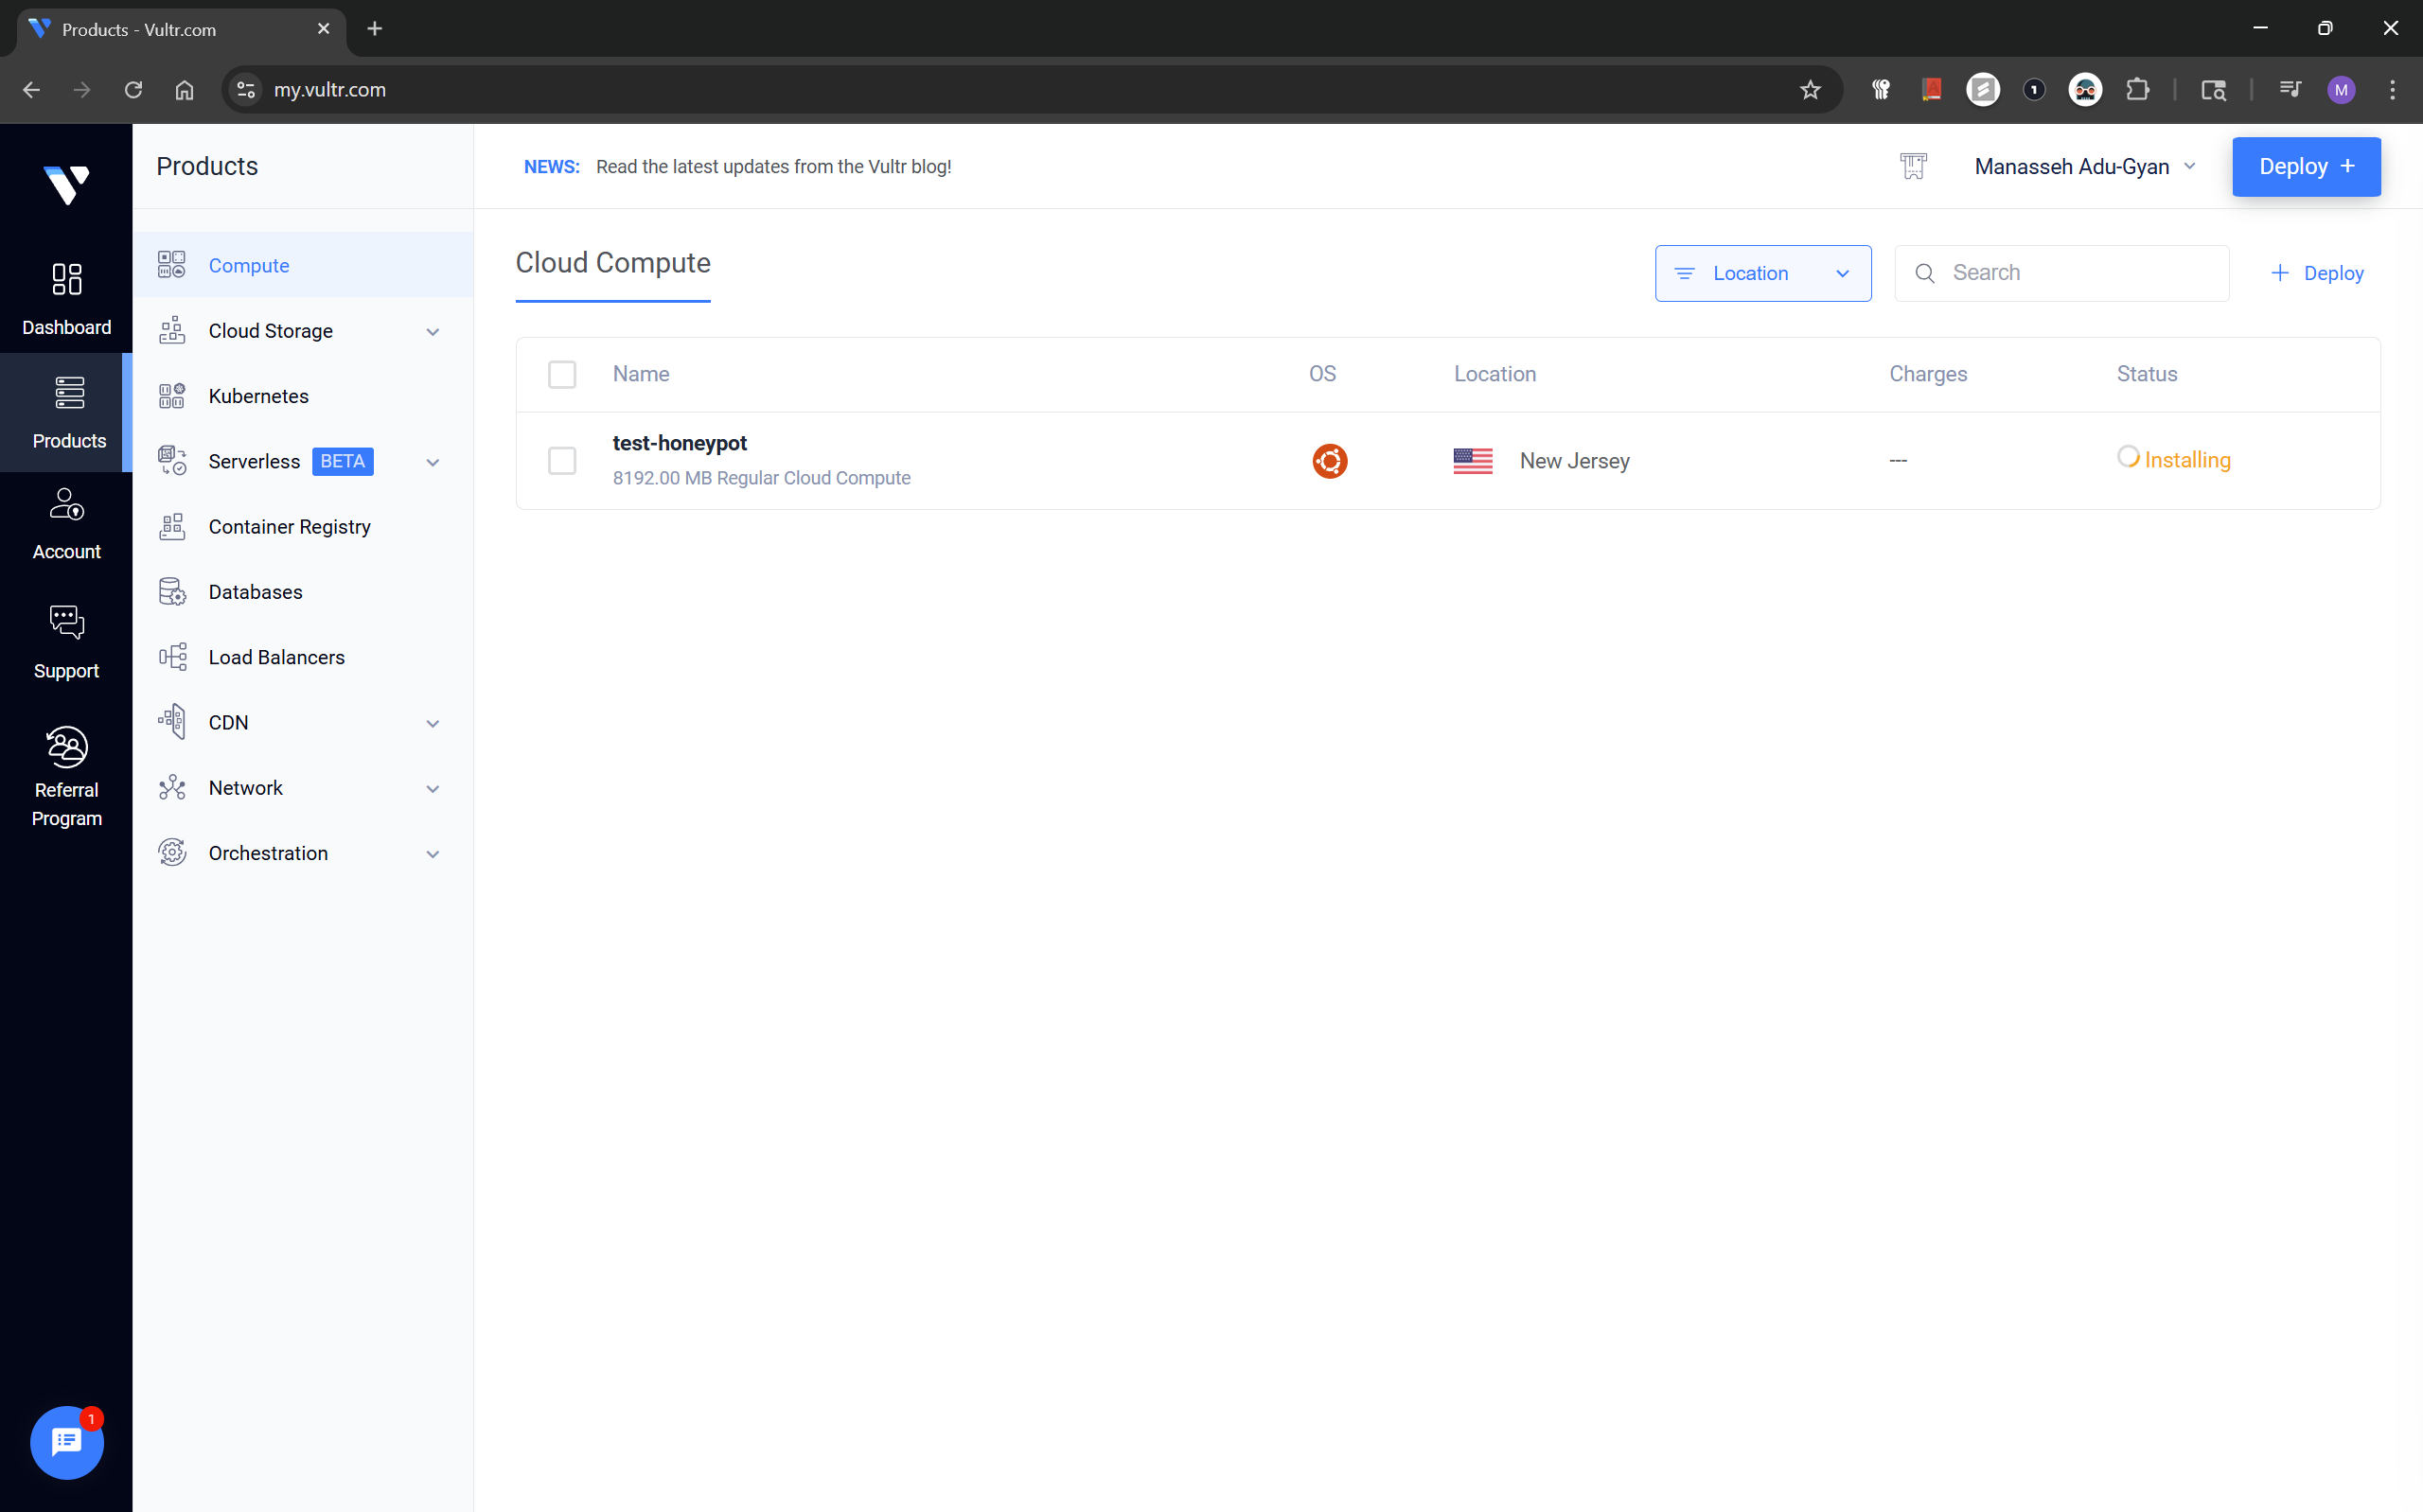
If you followed, the steps in the screenshots above you should have your cloud instance up and running now.
Setting Up a Vultr Firewall Group
Next, I created a Firewall Group named honeypot. Initial configuration, was to allow access to my instance using my IP by explicit allow.
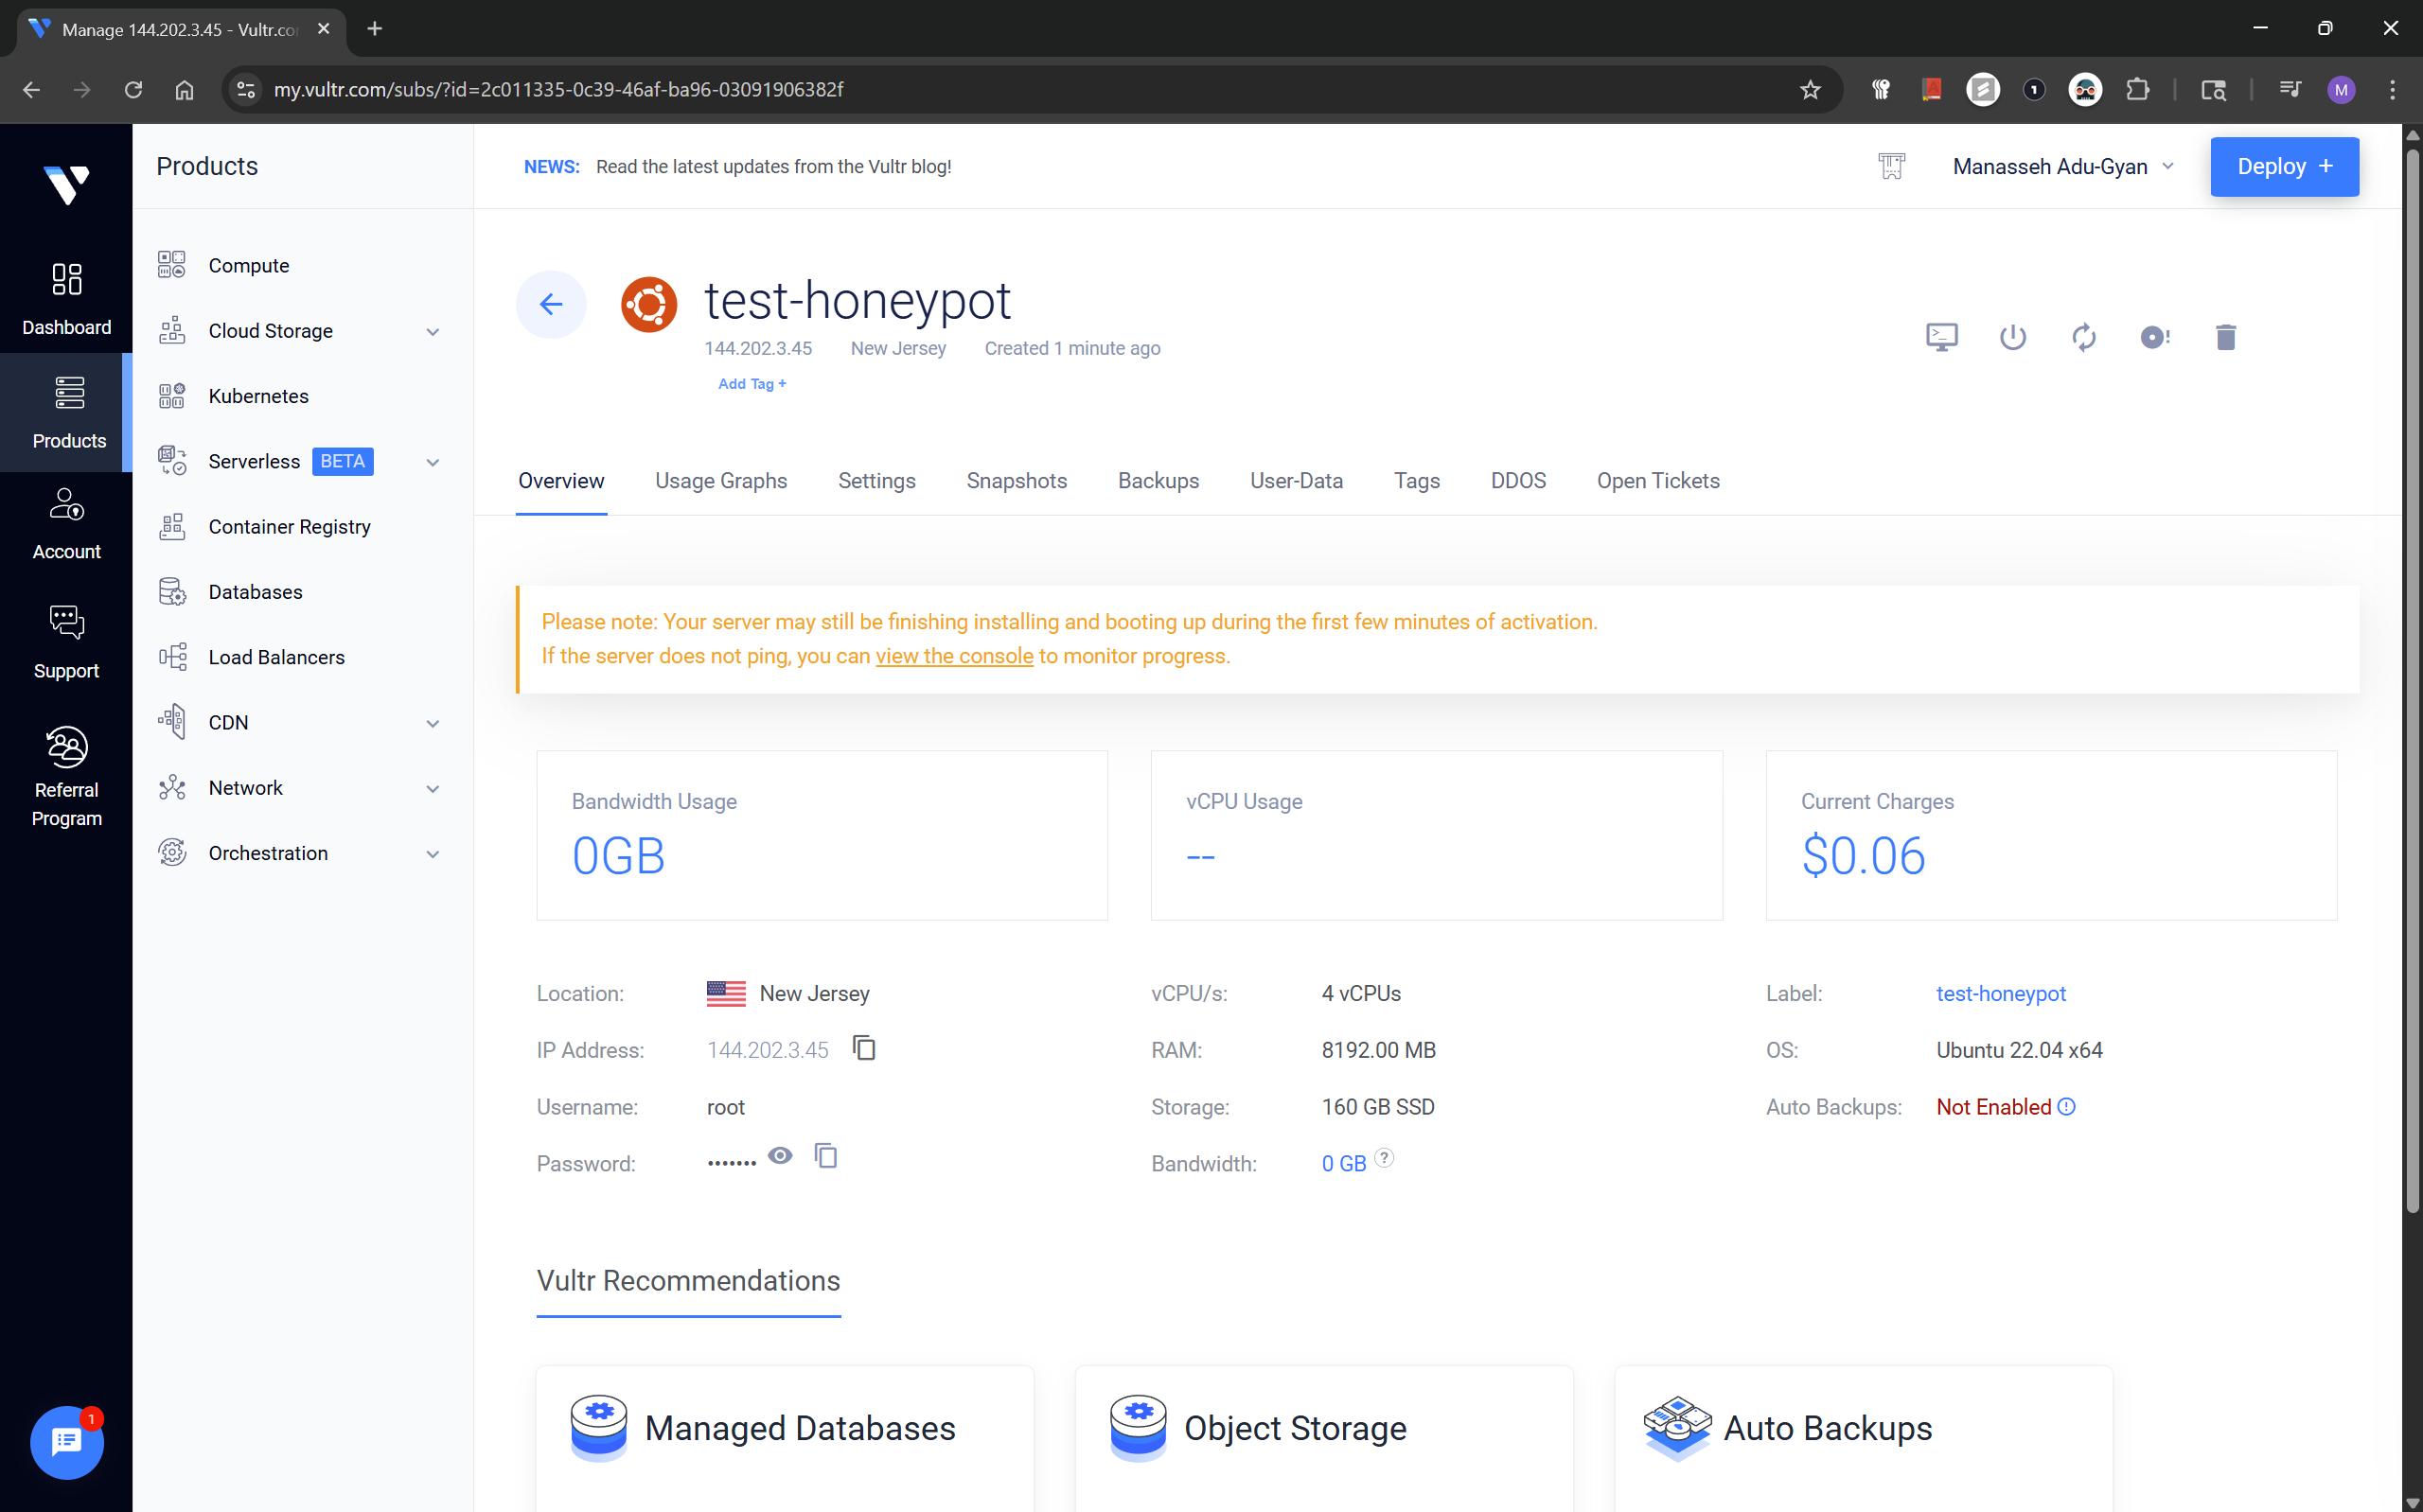
To do this, from the previous page, click the Instance.
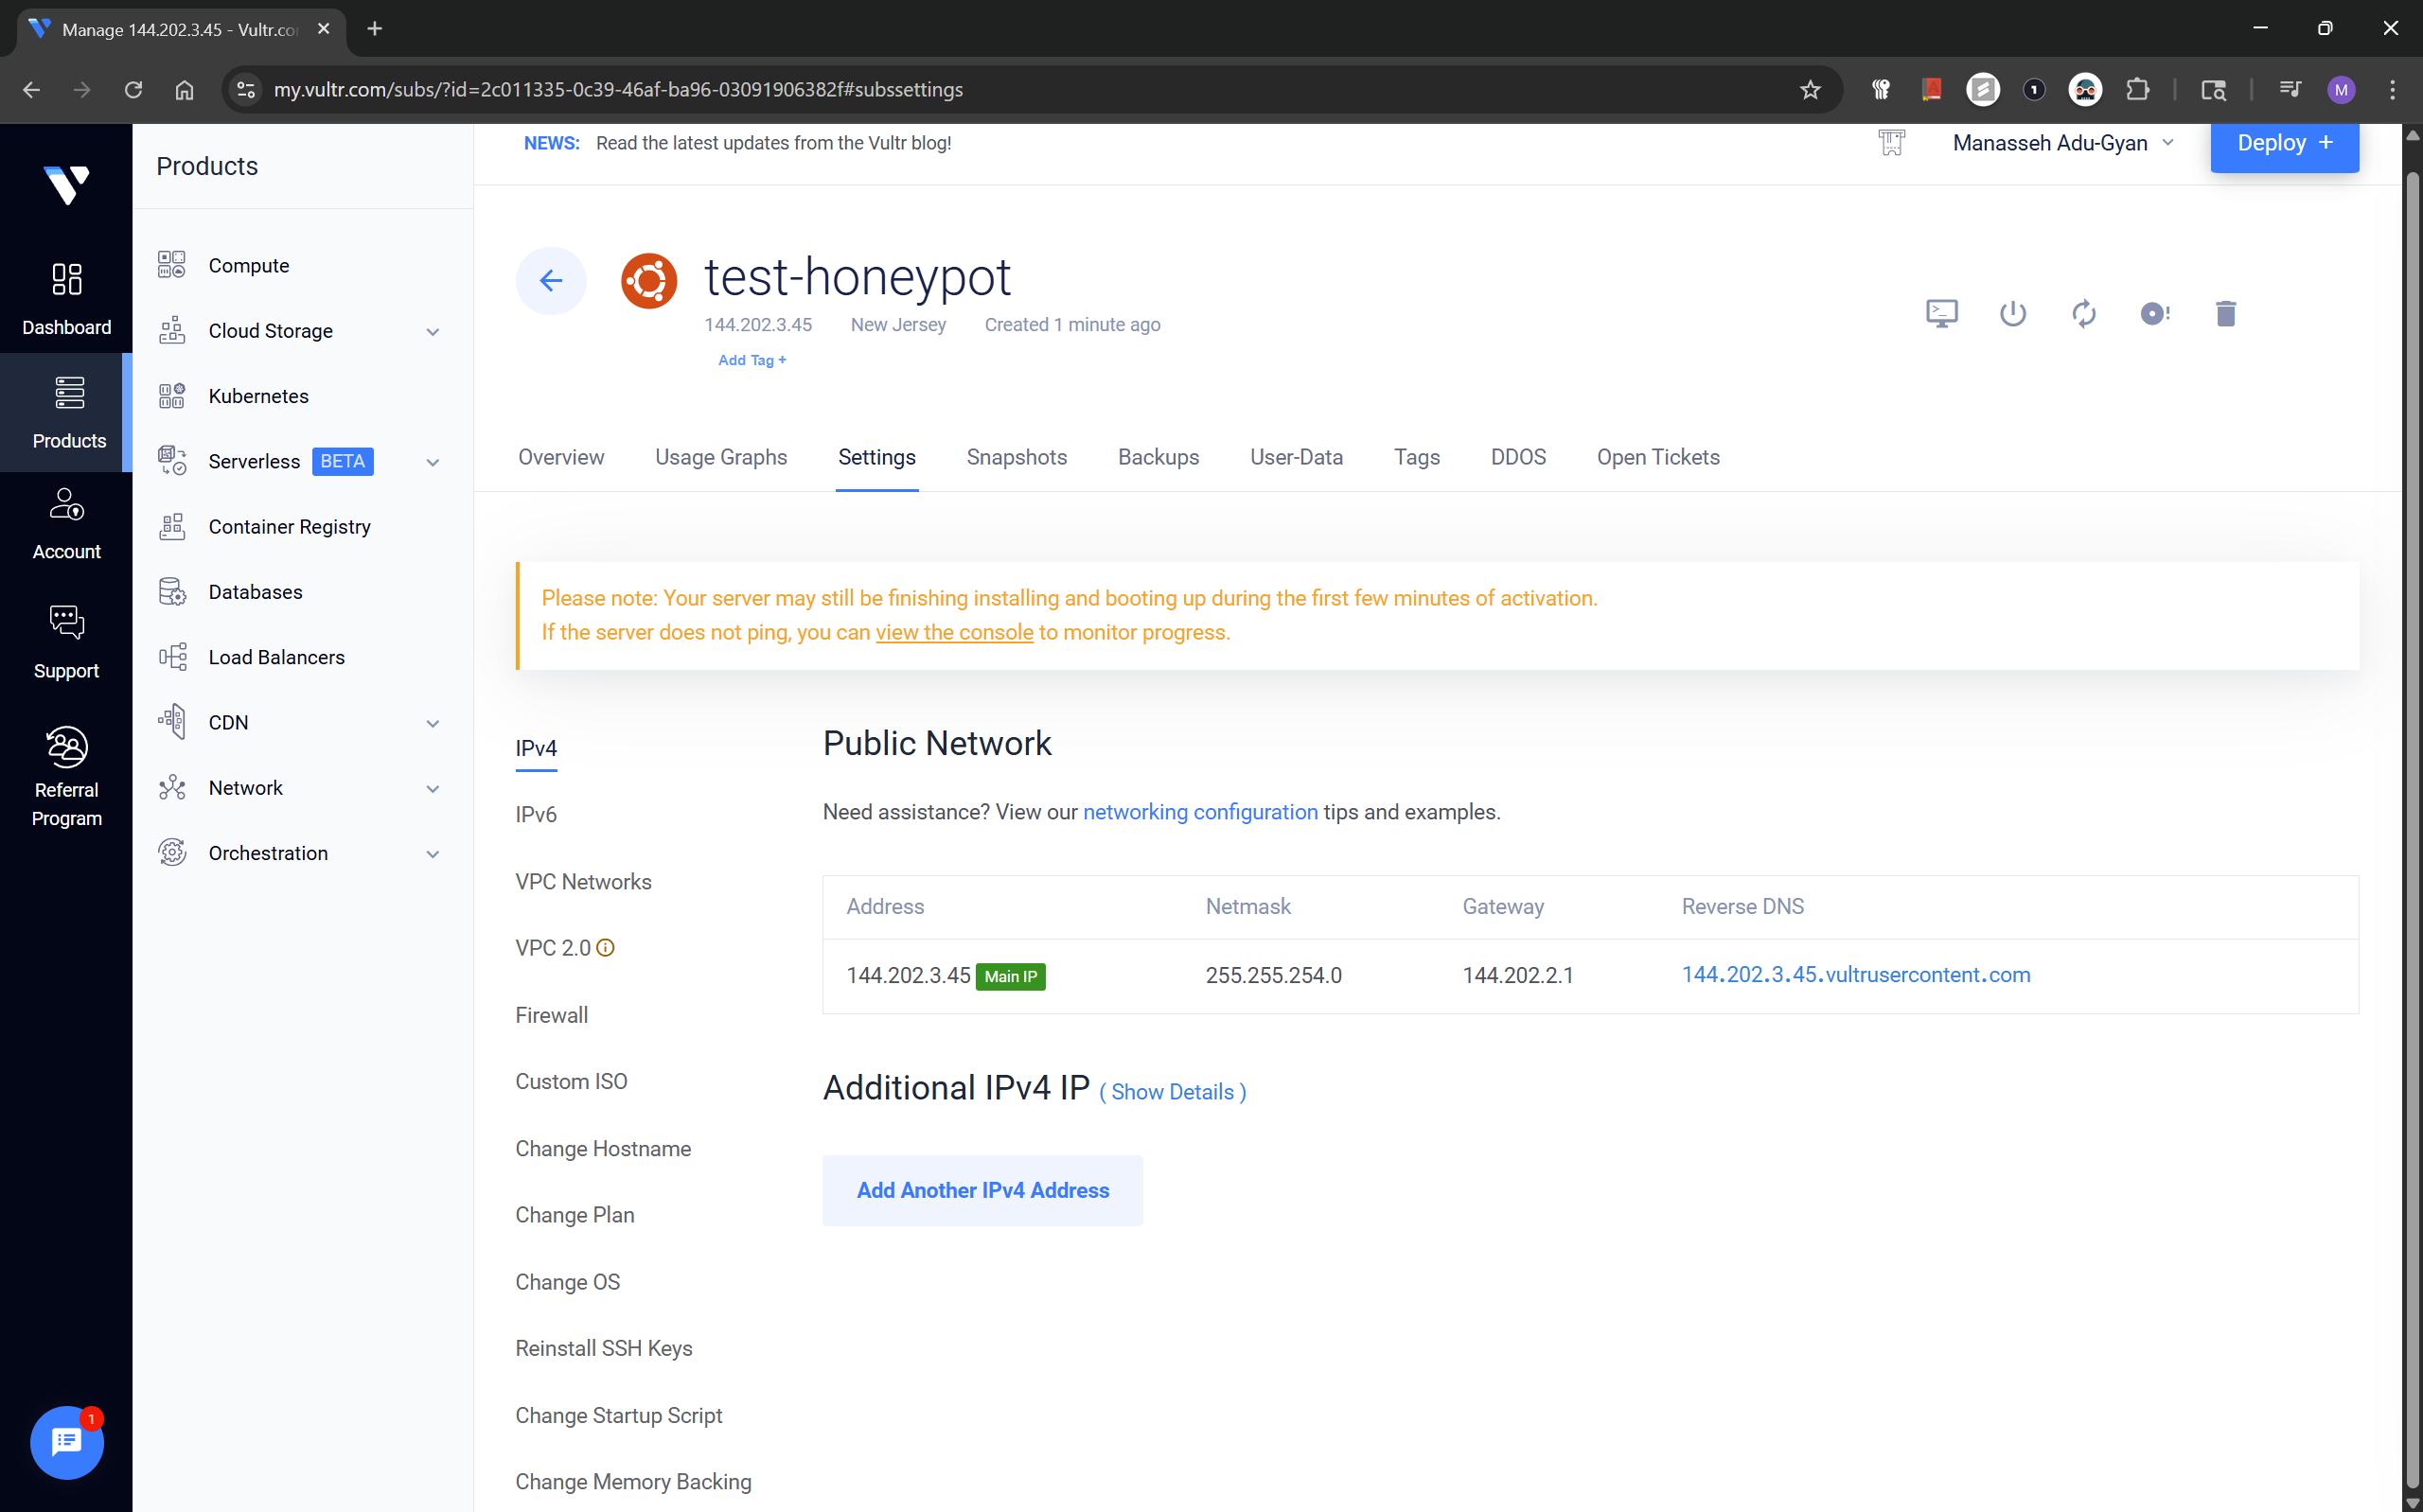
From the dashboard of your instance, click the Settings tab.
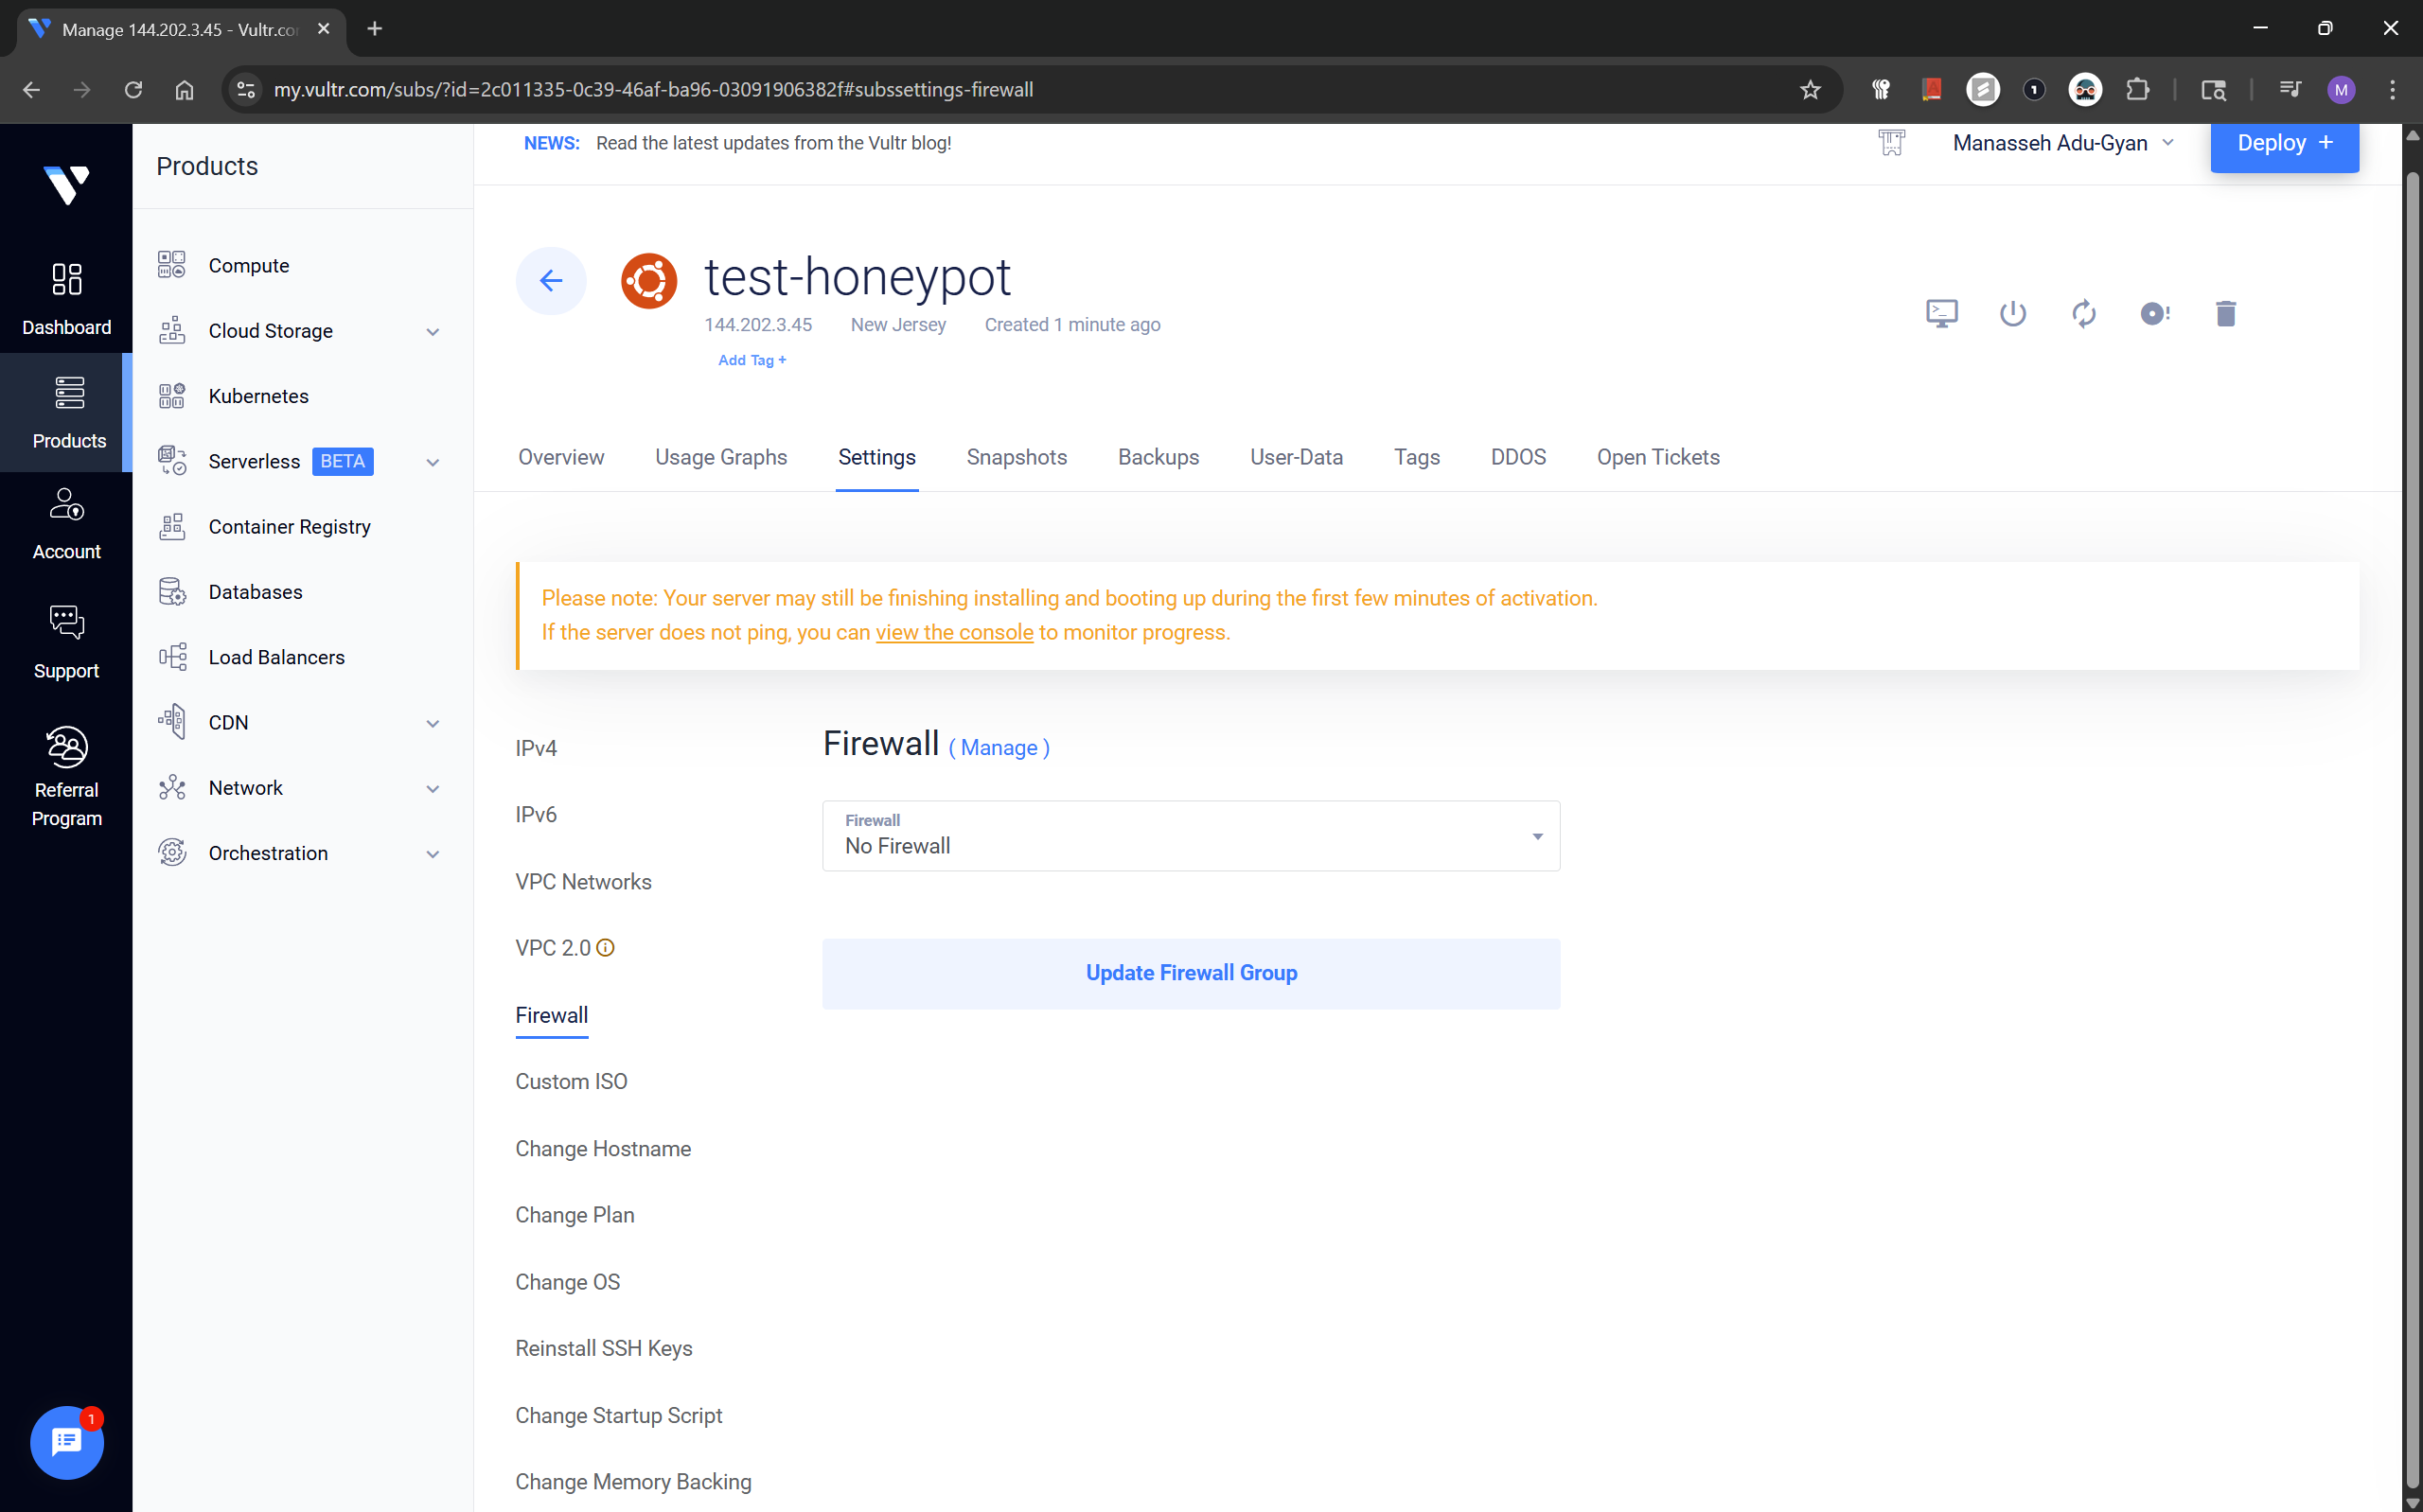
Under the options for Settings, click Firewall and the Manage hyperlink by the Firewall Header.
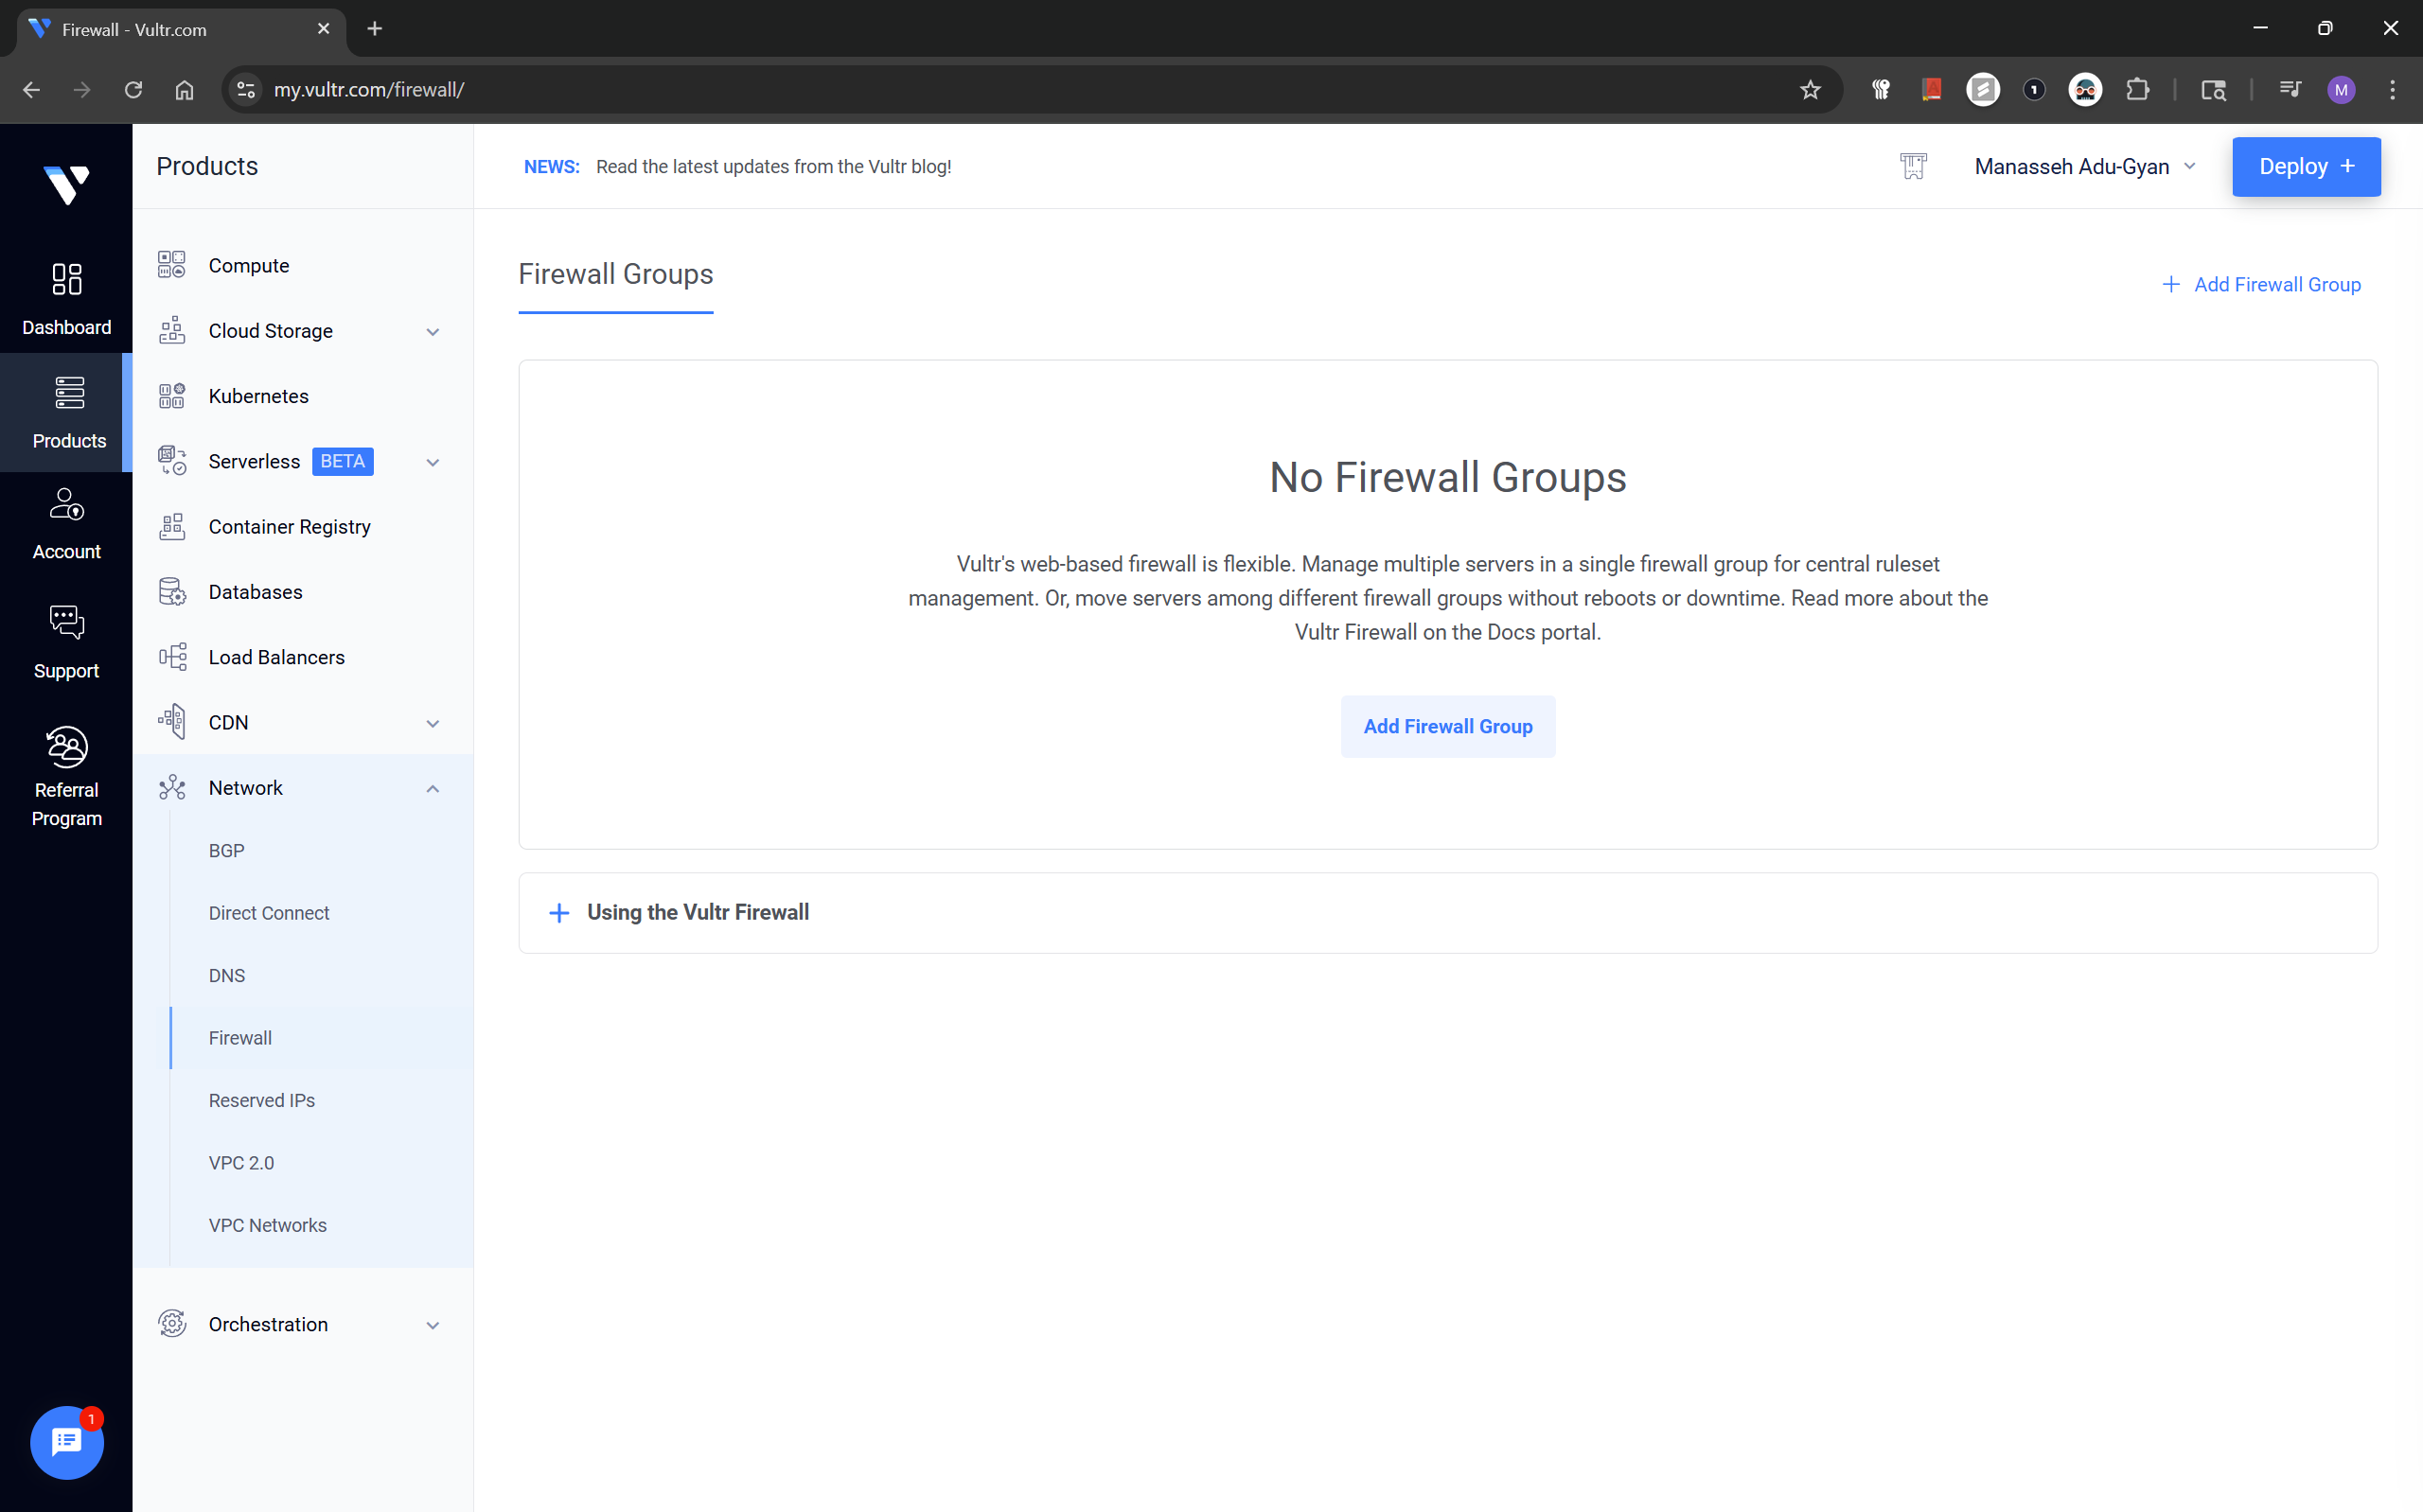
On this page, click the Add Firewall Group button.
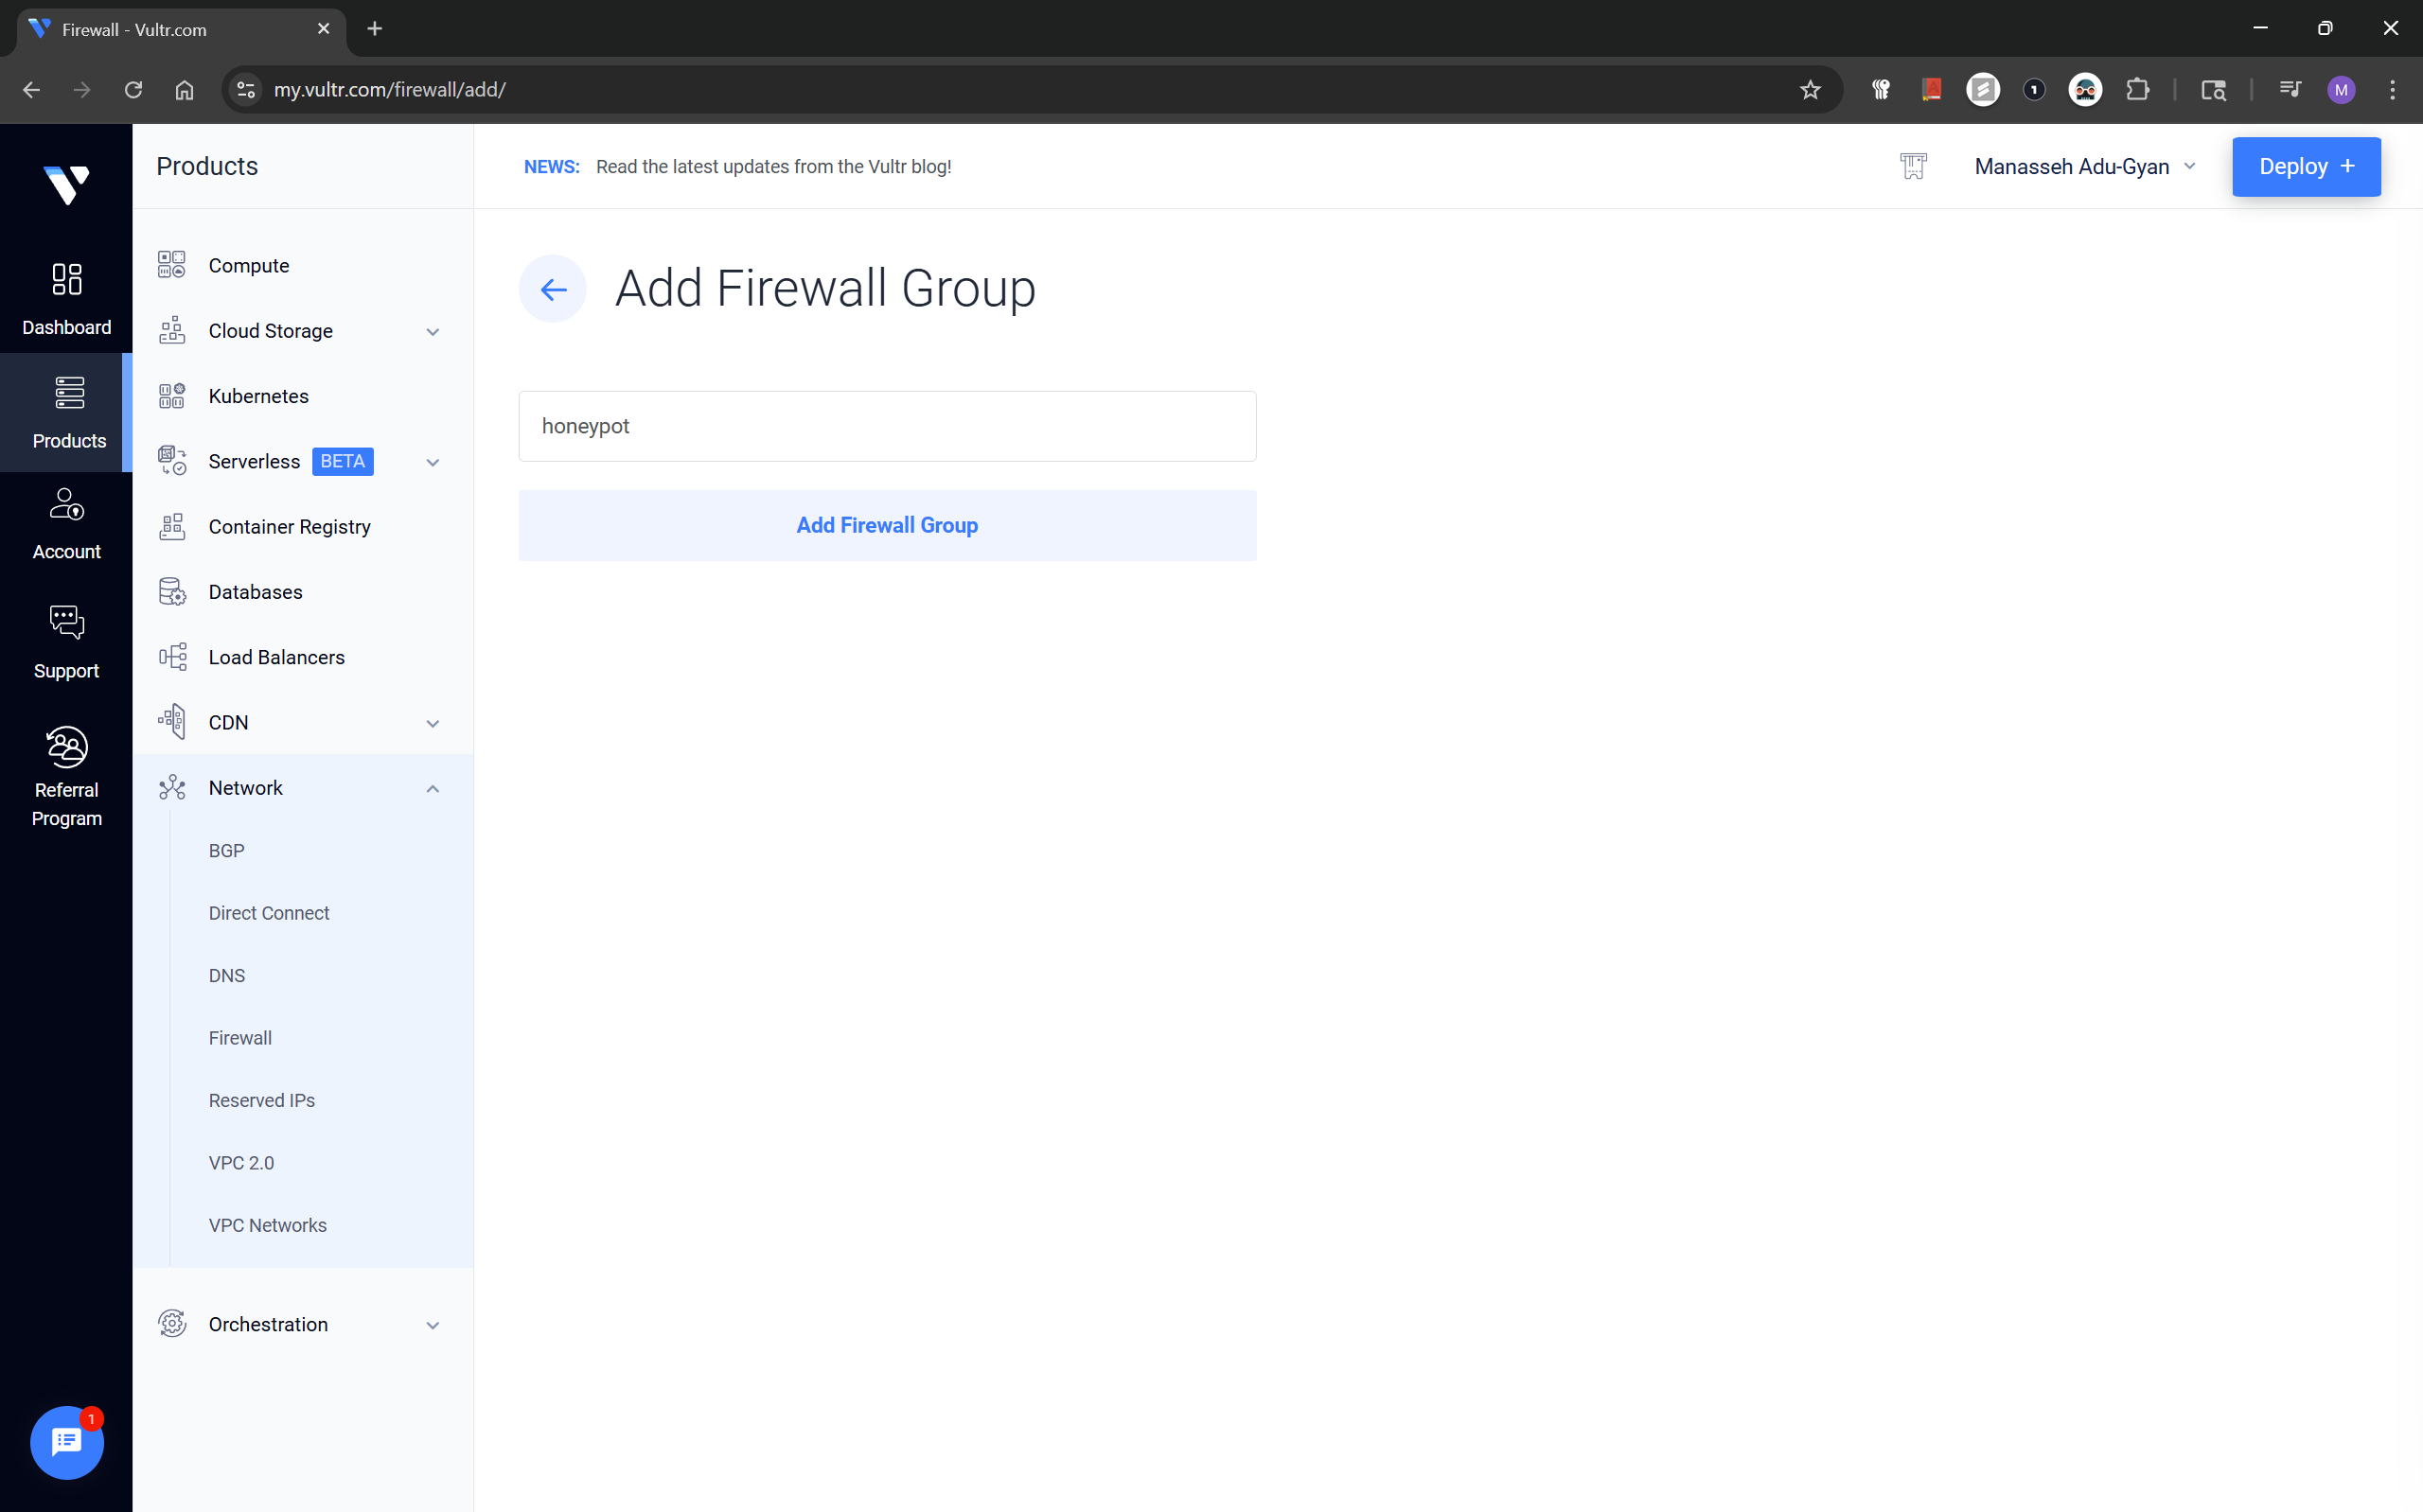
Choose a custom name you want for the firewall, I chose honeypot for my firewall.
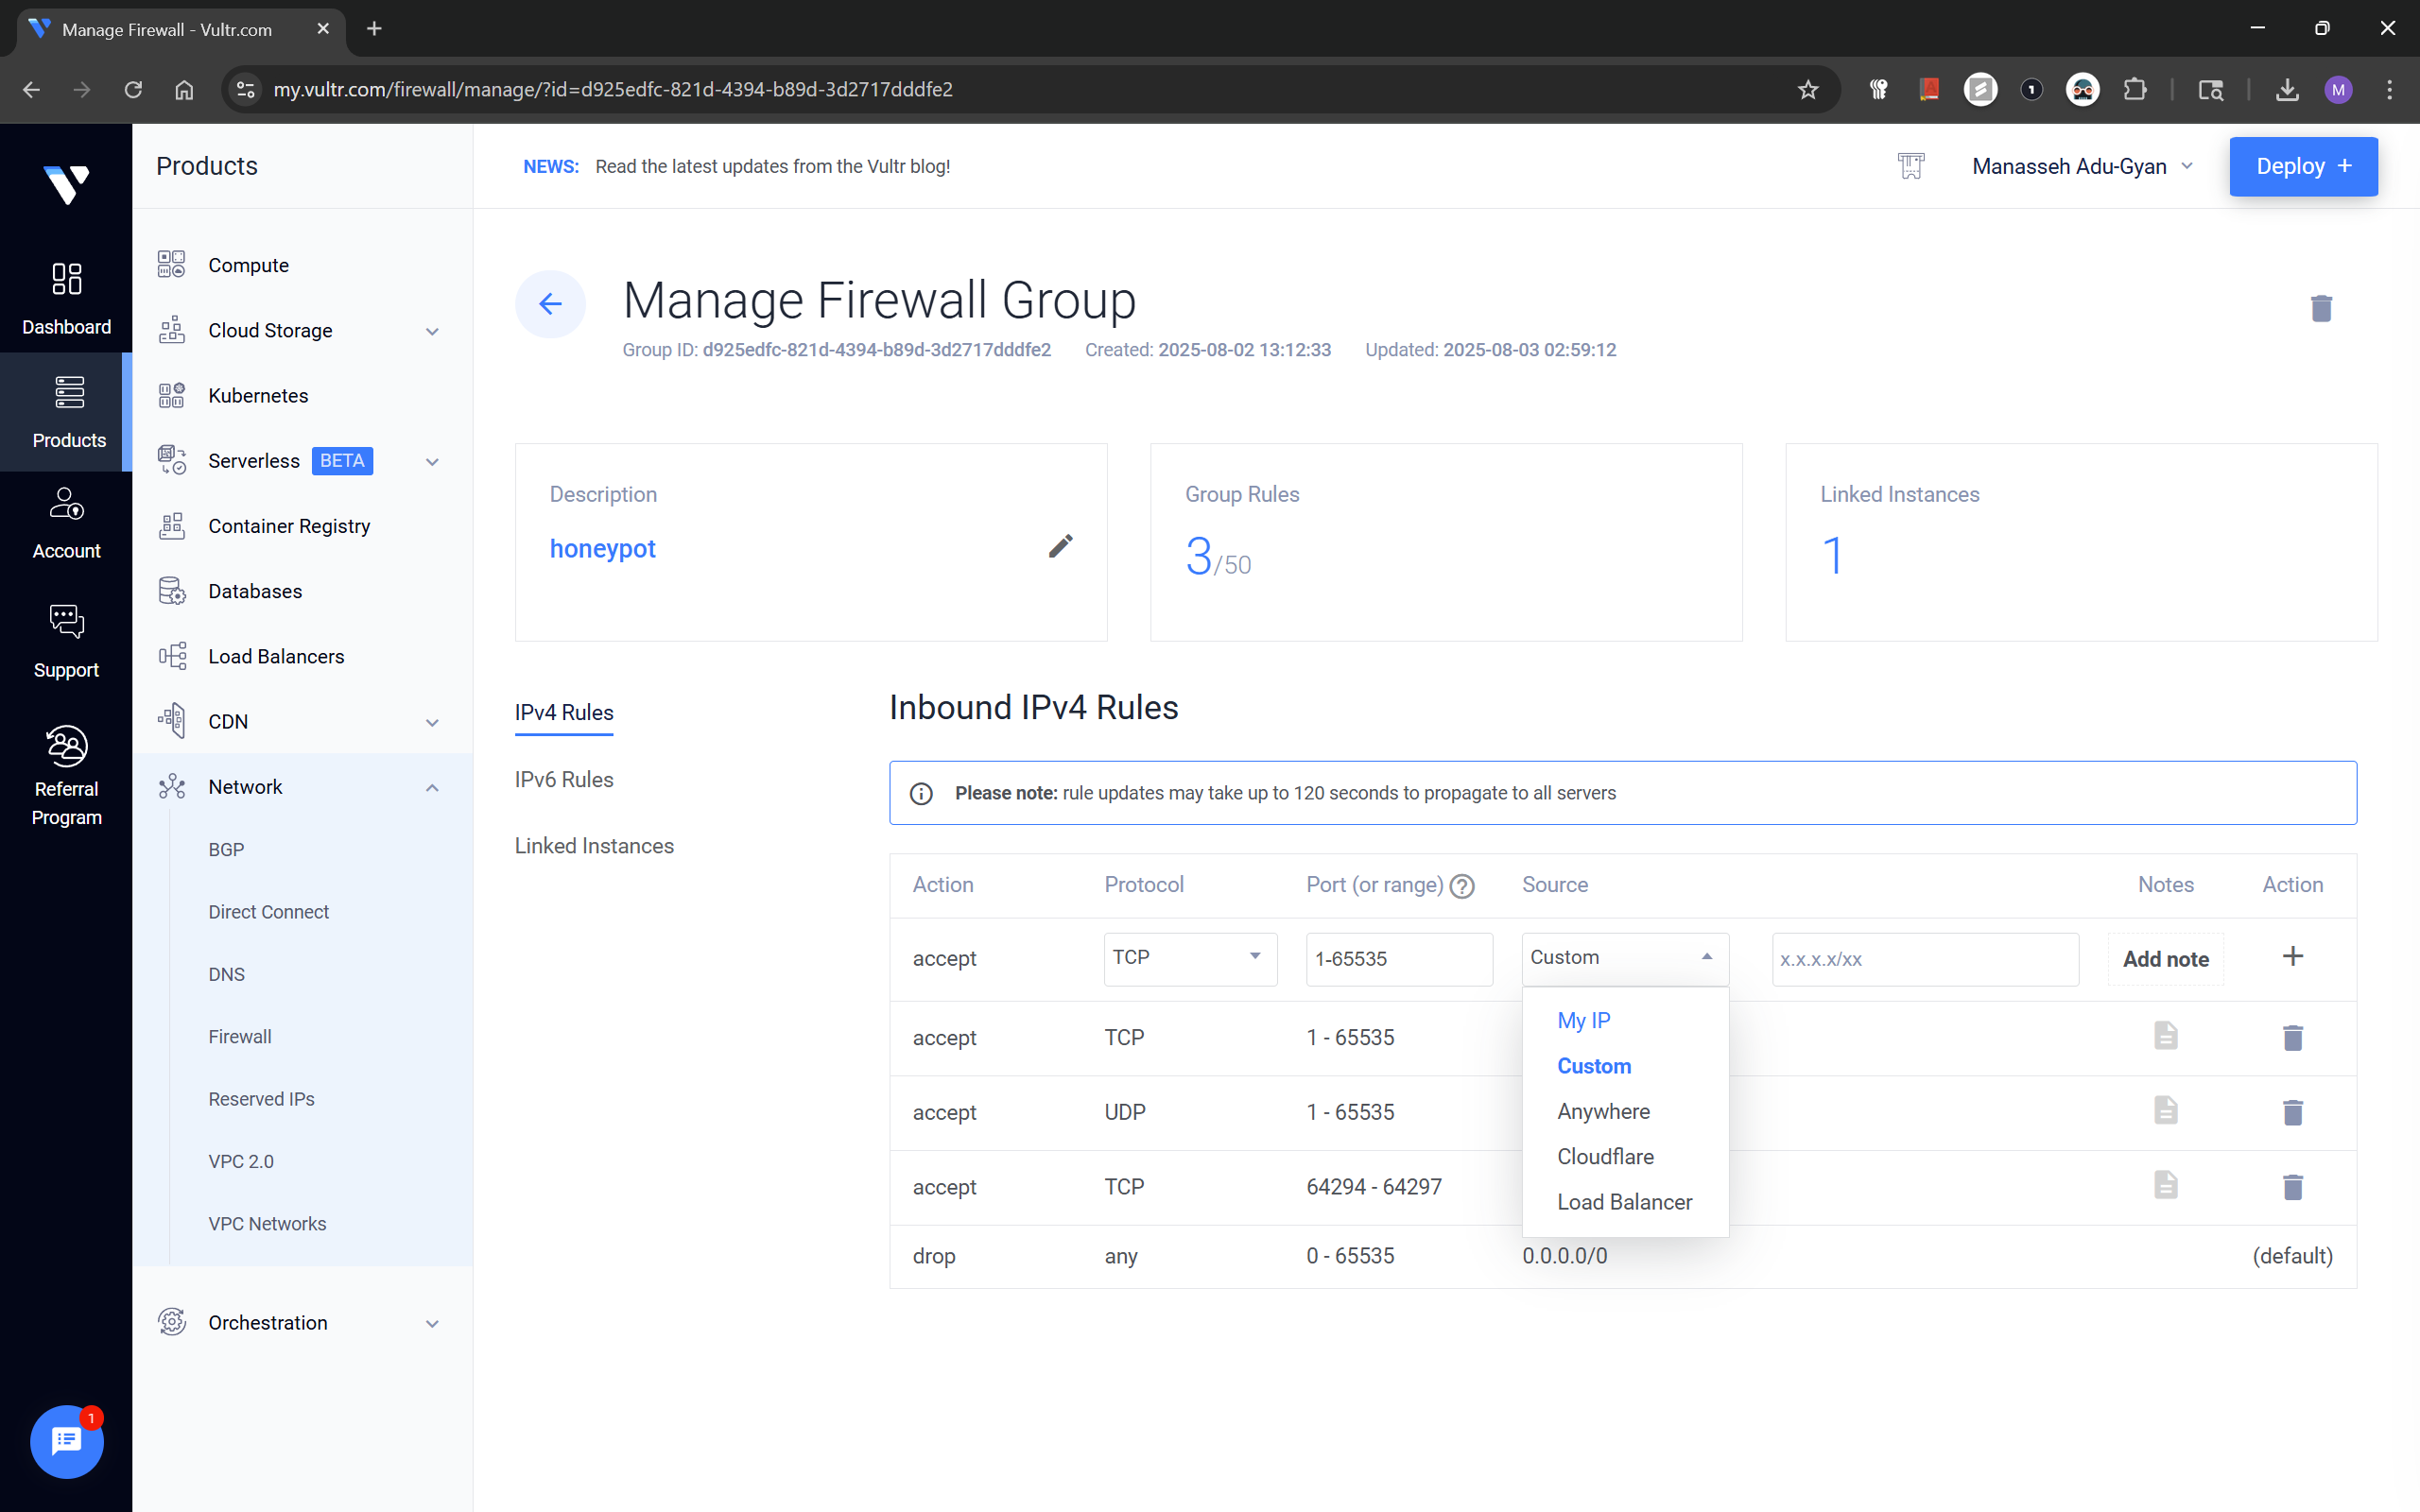
The rules we will add in this step are,
Accept; TCP - Port - 1:65535; Source - My IP
Accept; TCP - Port - 1:65535; Source - My IP
This enables access to the Virtual Instance only from your public IPv4 for the installation process.
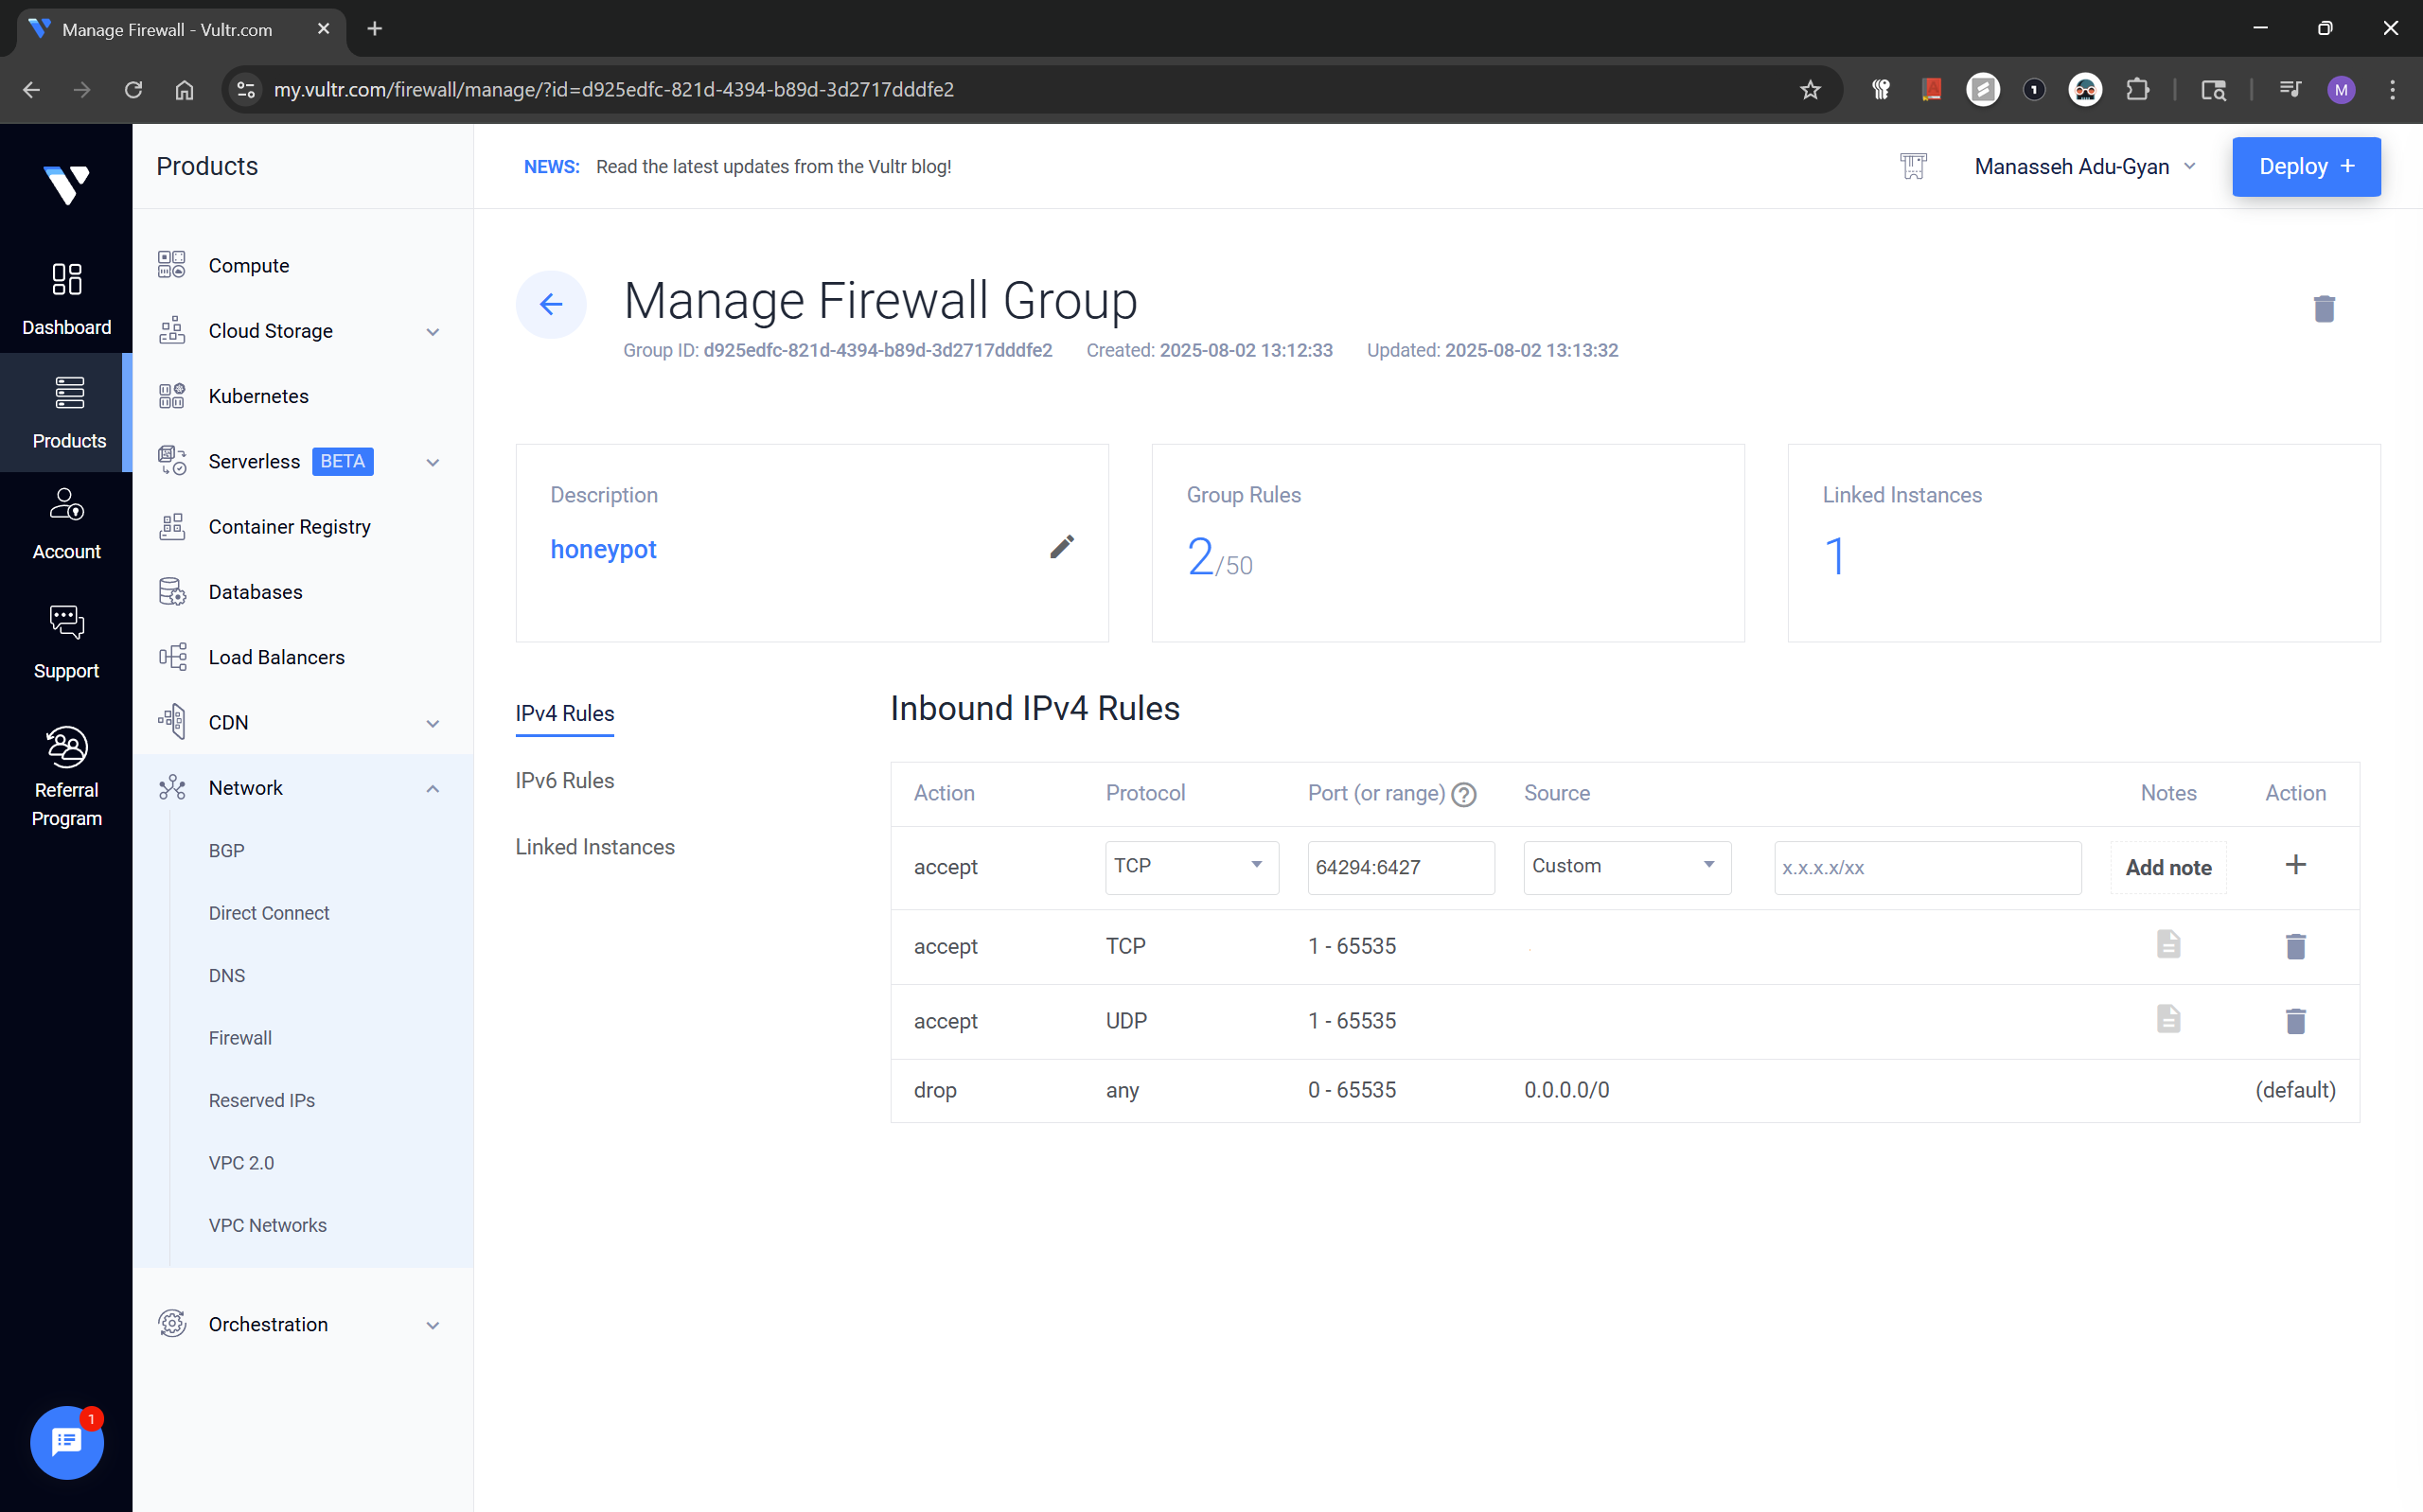
The firewall group should looks as above, after previous step is done.
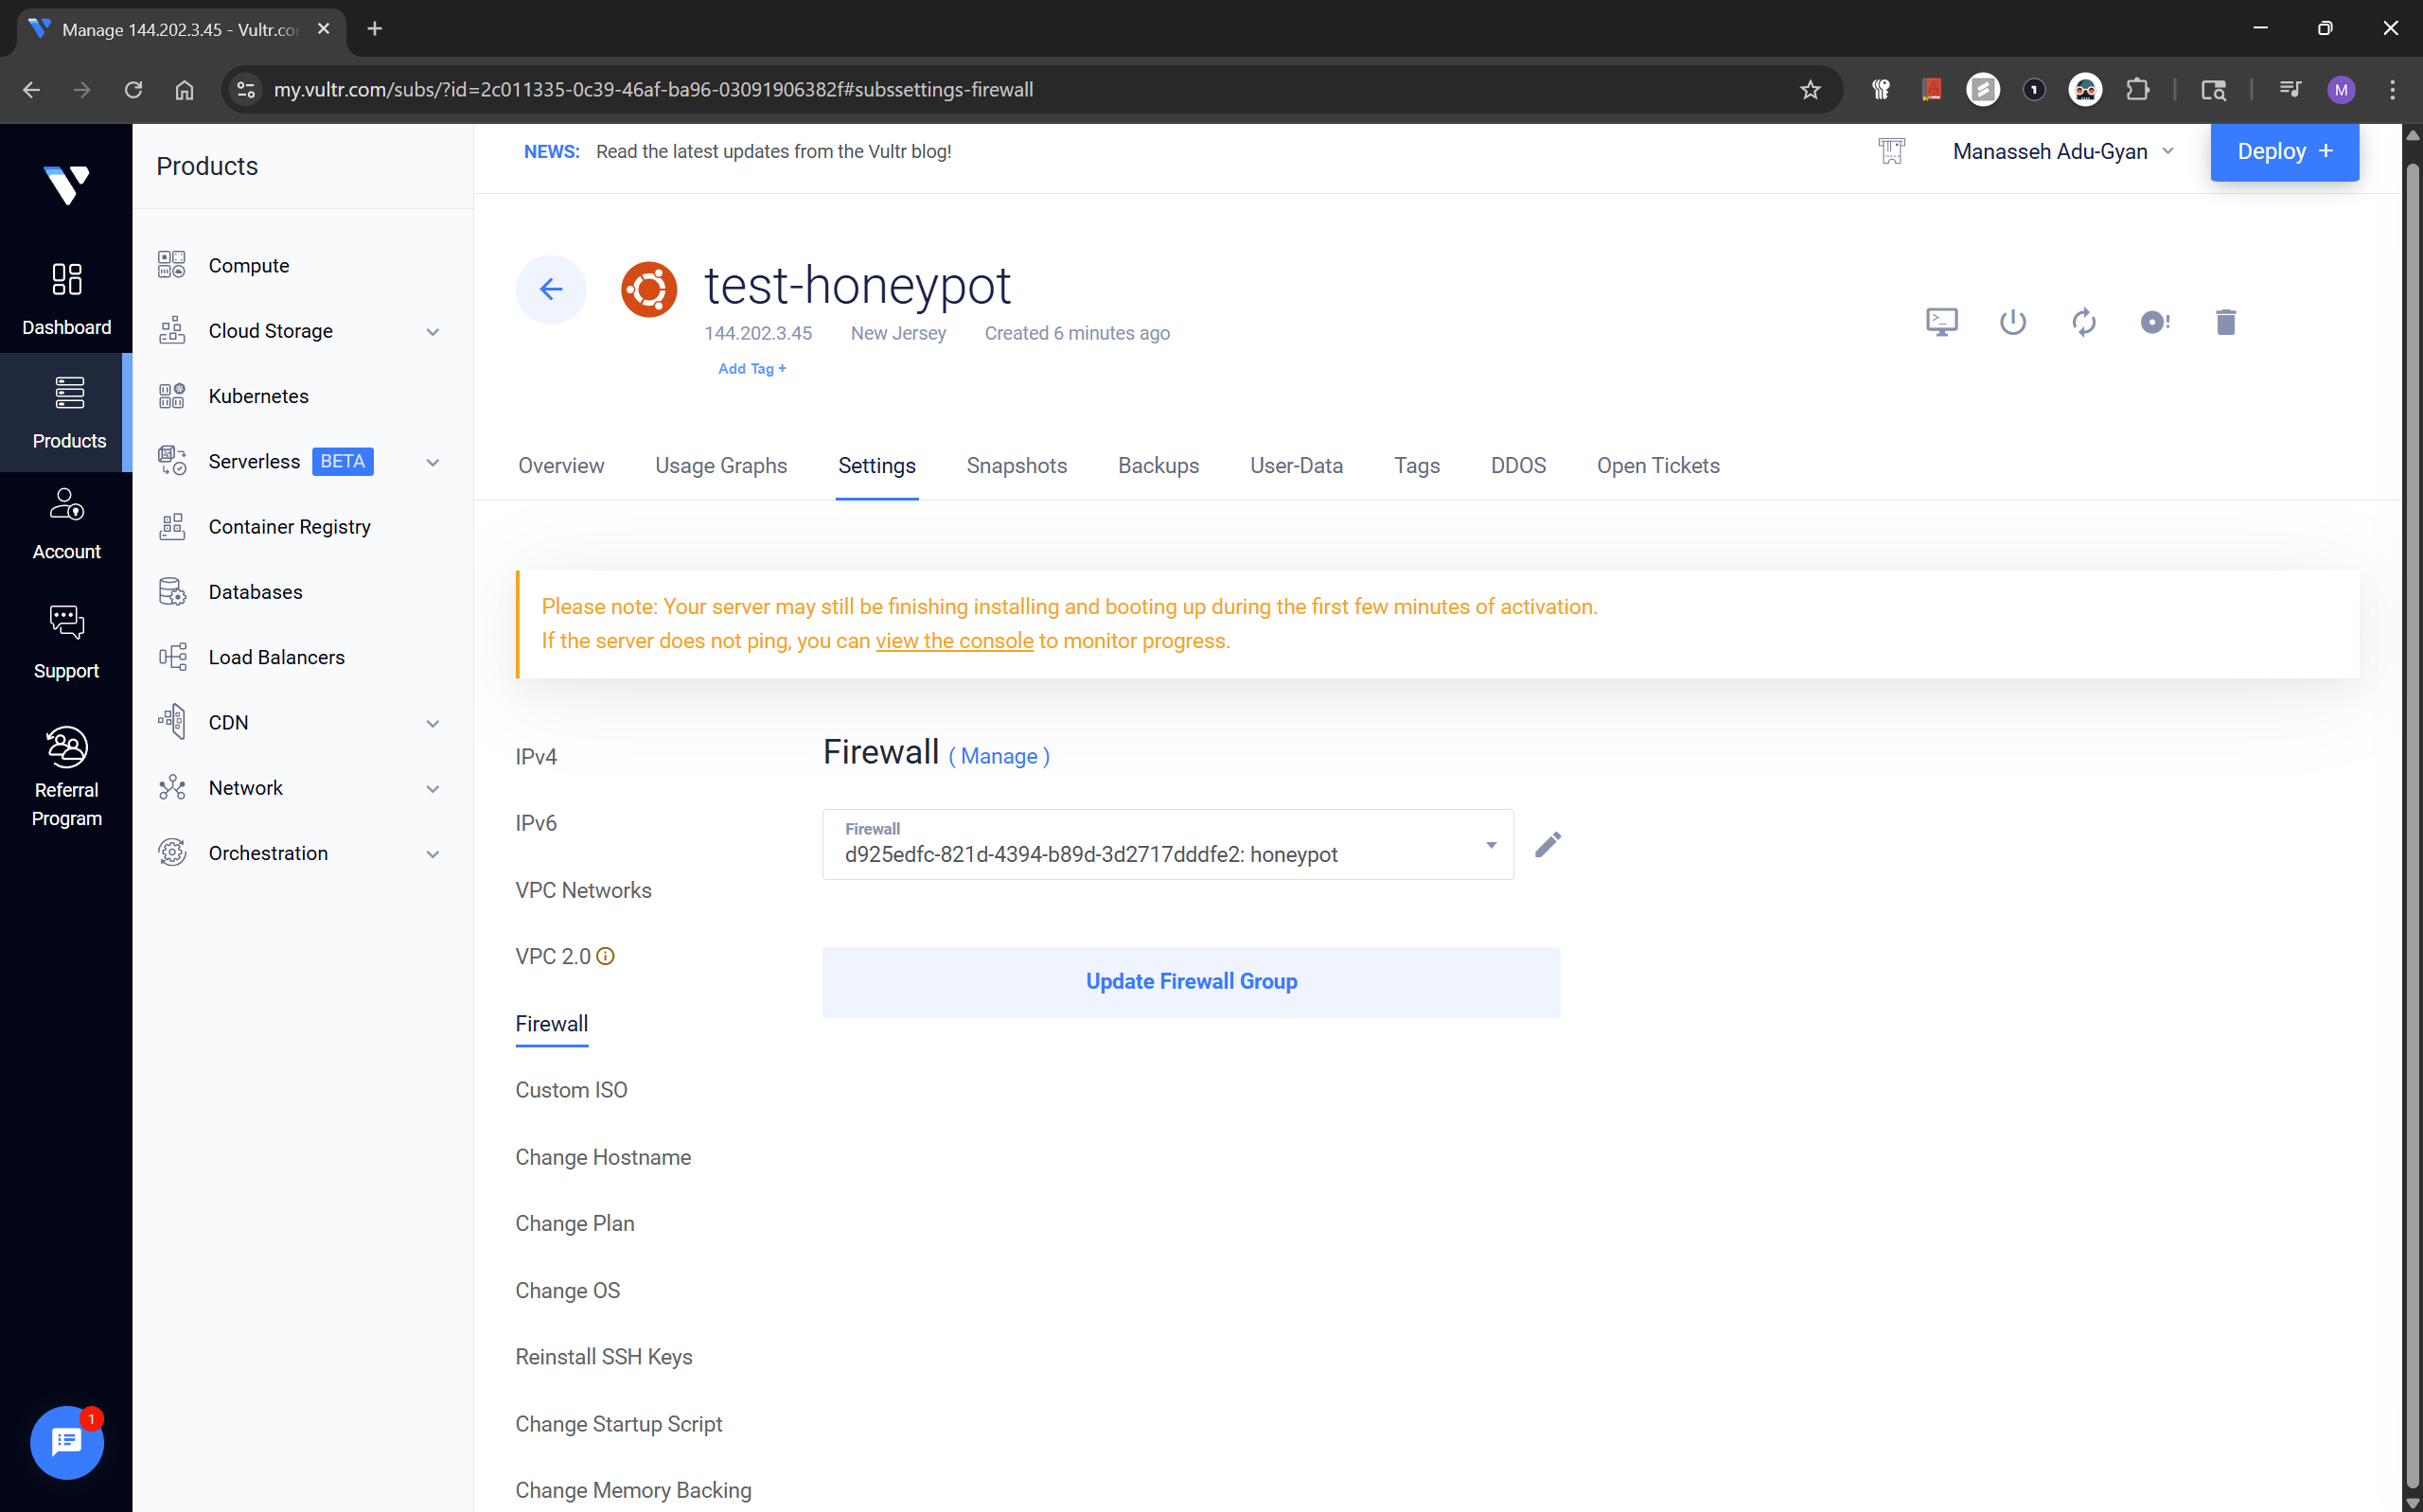
After creating the group, I attached it to the instance via the Settings → Firewall tab of the instance.
Creating a Non-Root Sudo User
Once the instance booted, I accessed the noVNC console and created a dedicated user:
To access the console click the console icon in your instance dashboard. I highlighted the Console button and where to find the logins in the screenshot below;
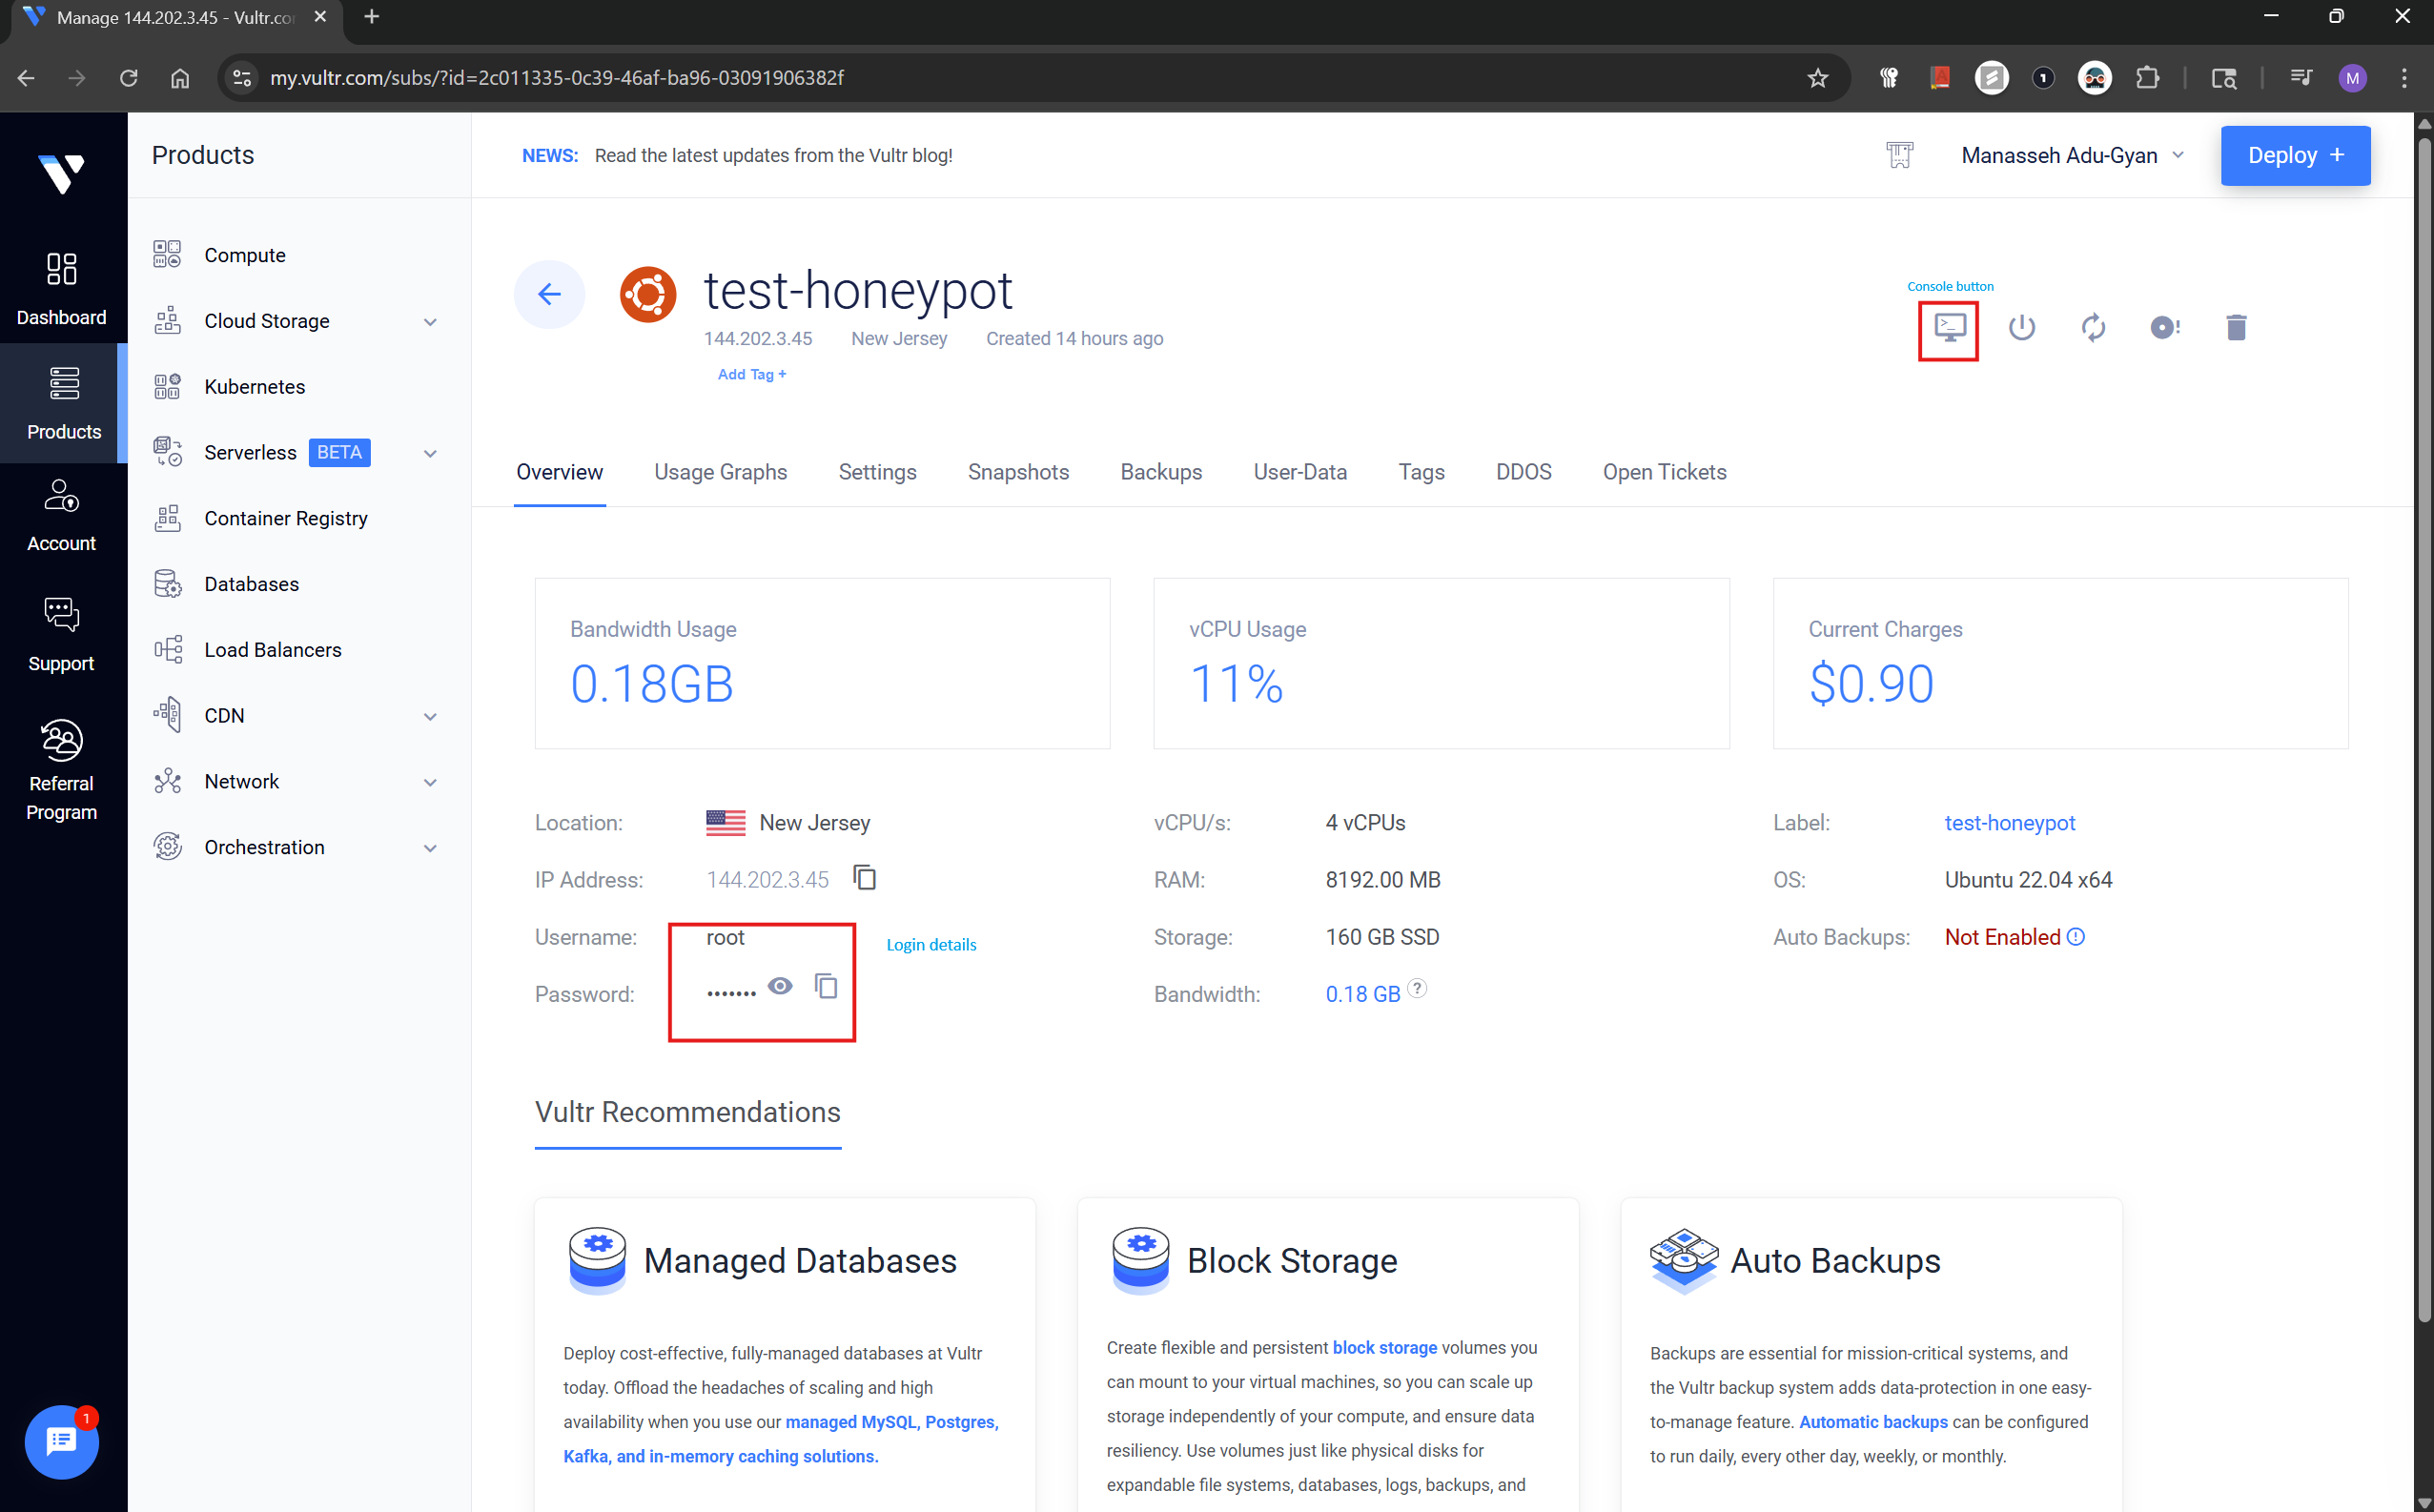
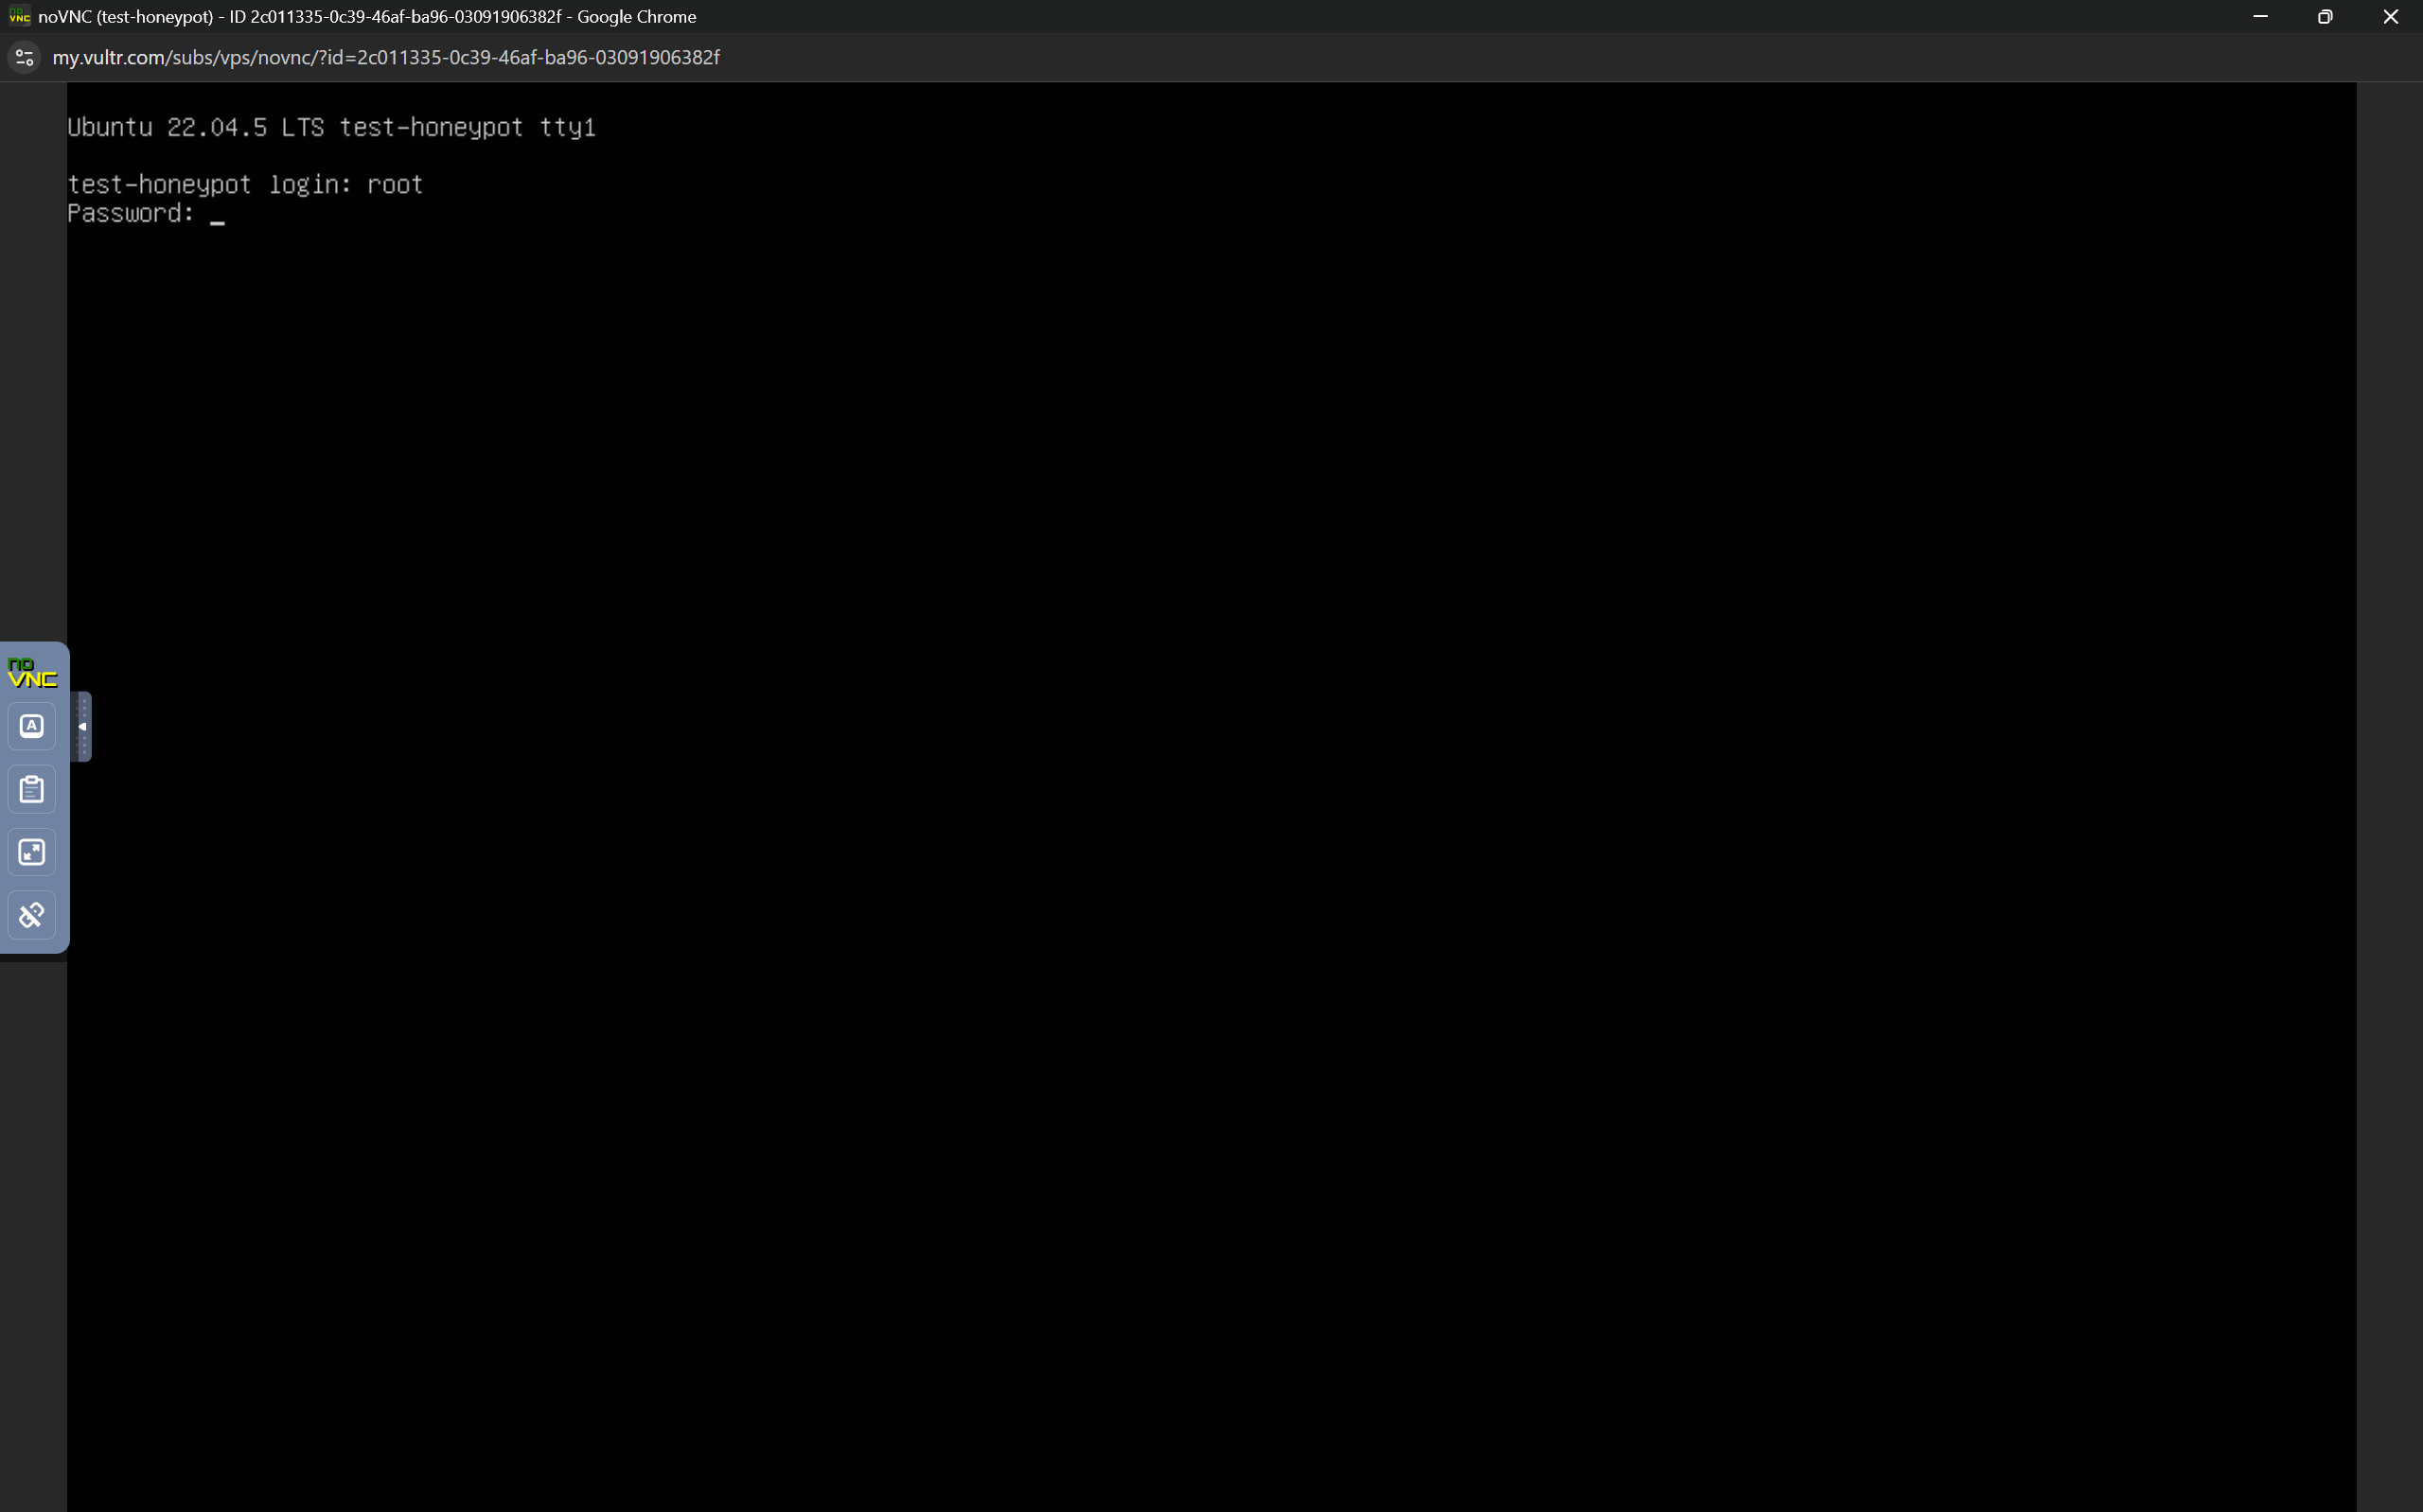
As seen above, enter root at first prompt and the copied password on the second-prompt.
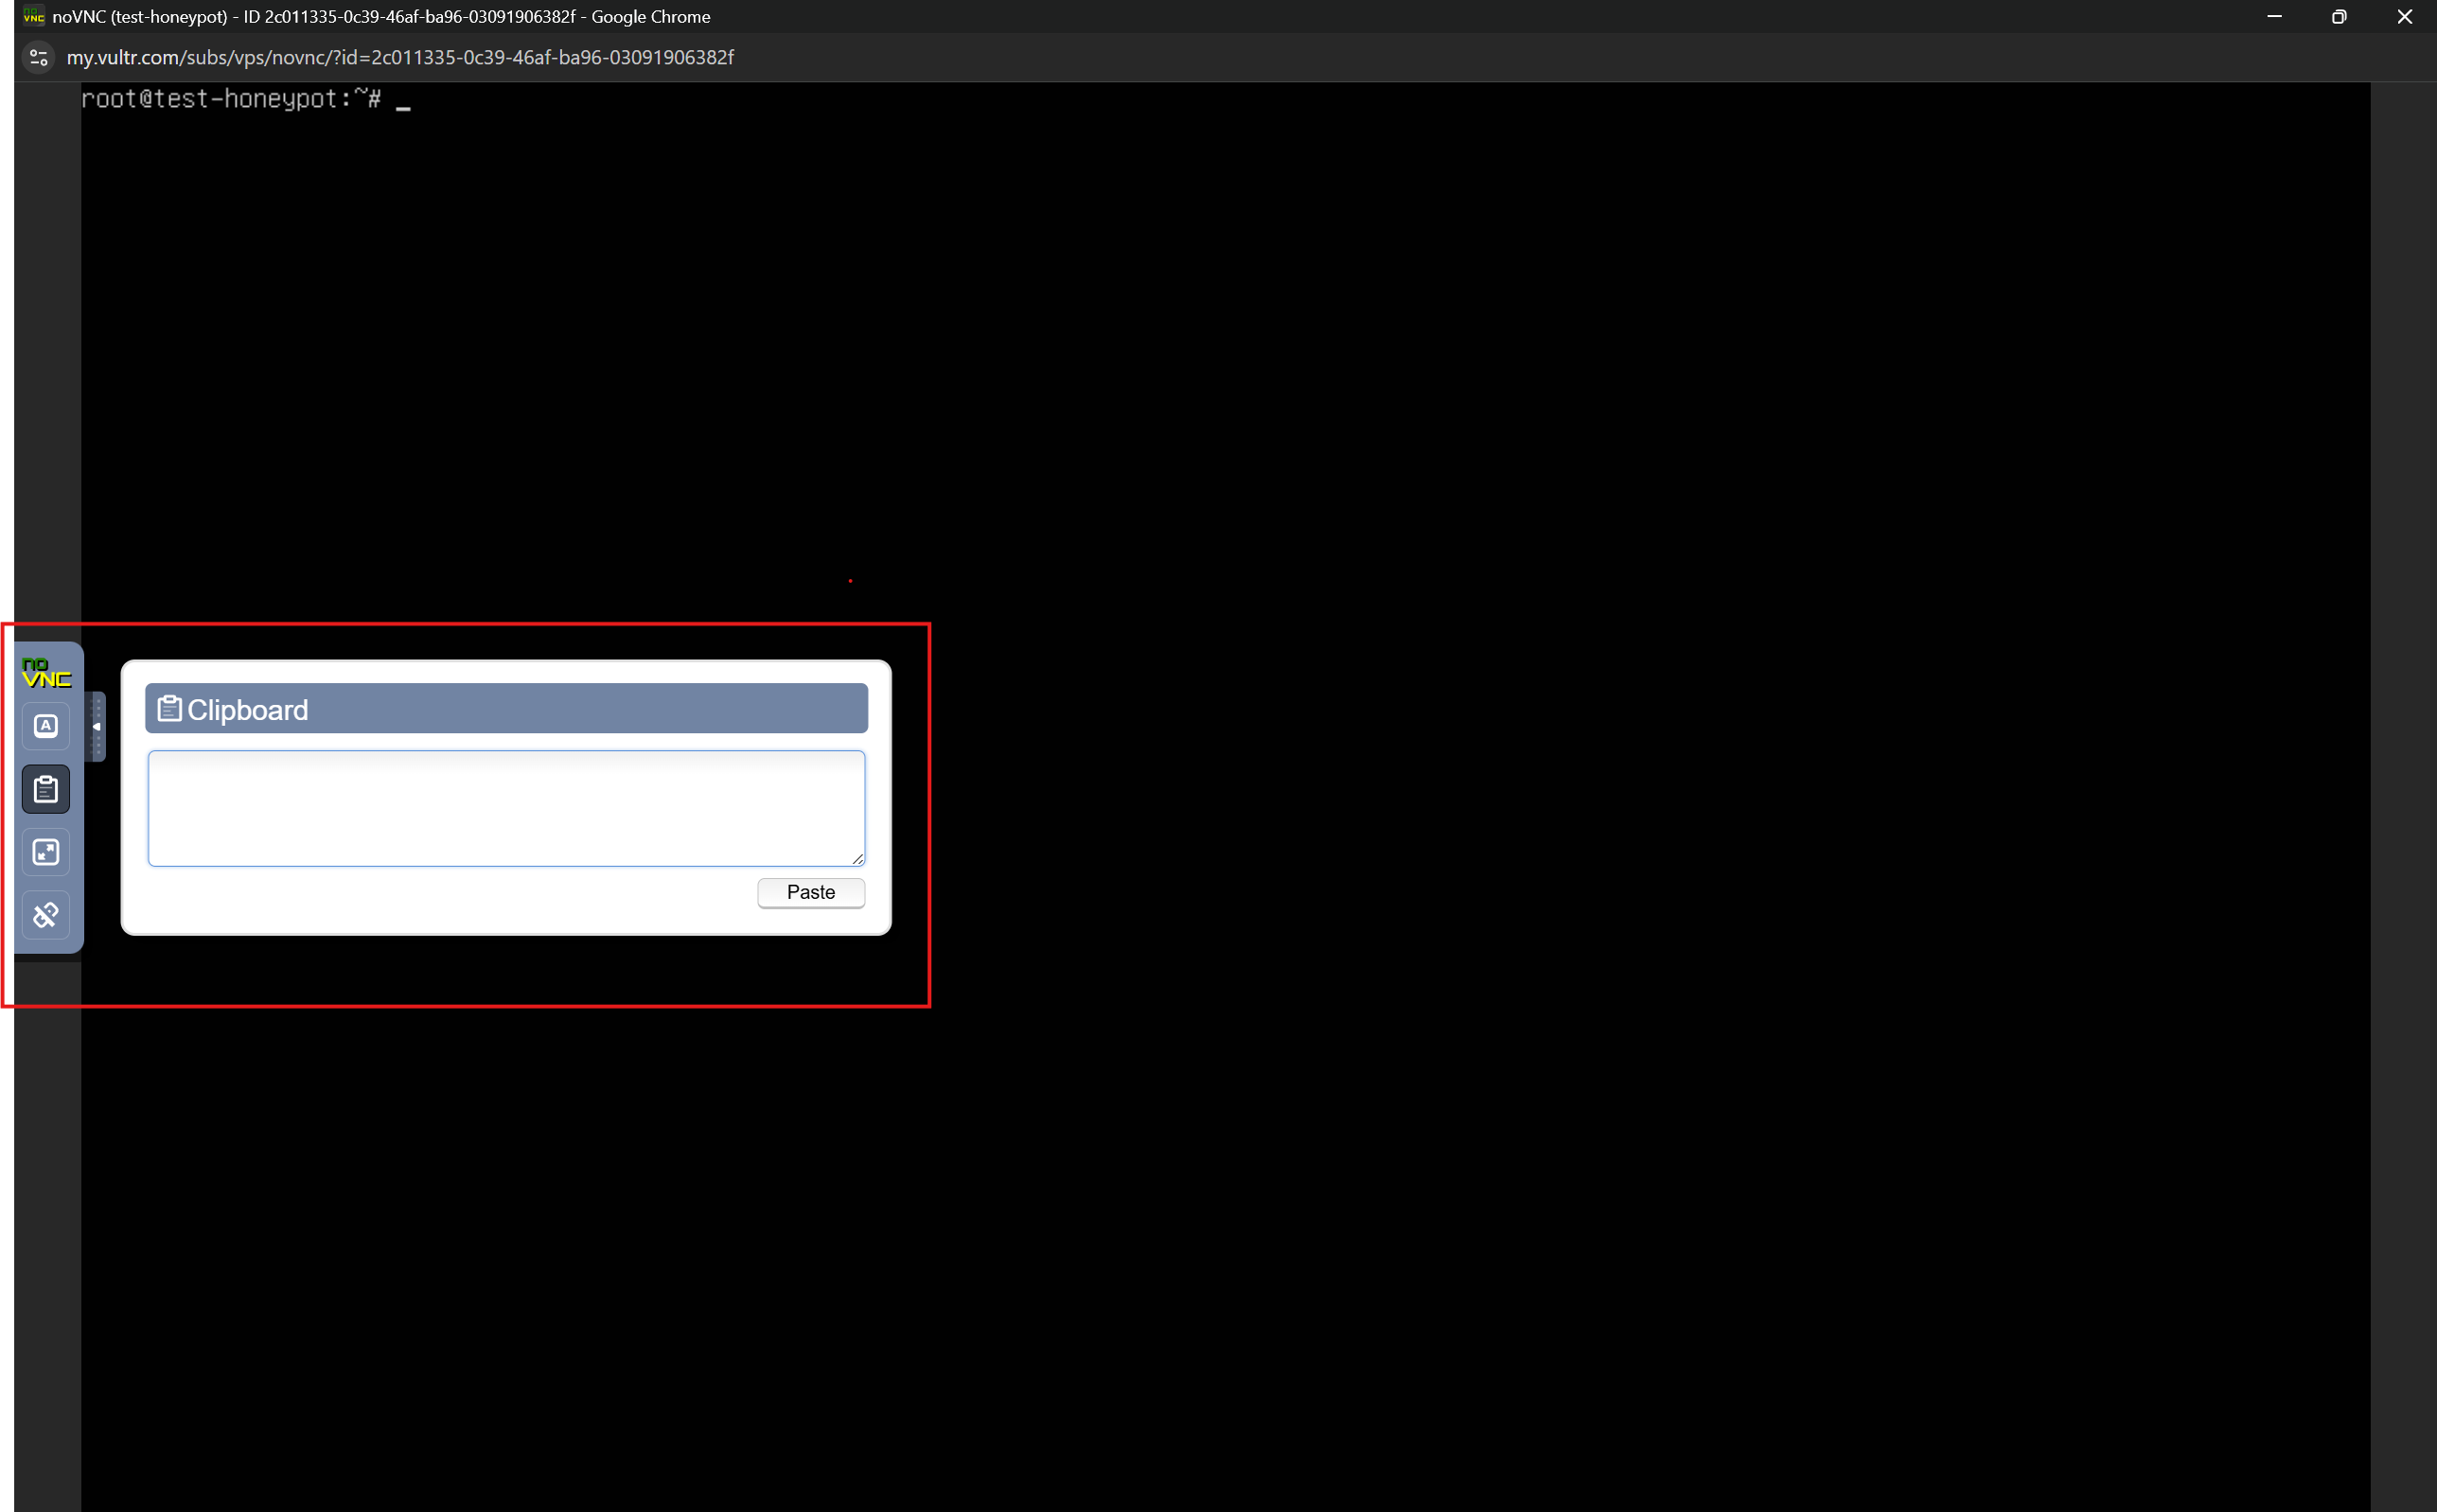
To copy and paste the commands, instead of manually typing it, we can use noVNC's pasting functionality. Just copy and paste commands like the image below. The commands will successfully be pasted when you do this.
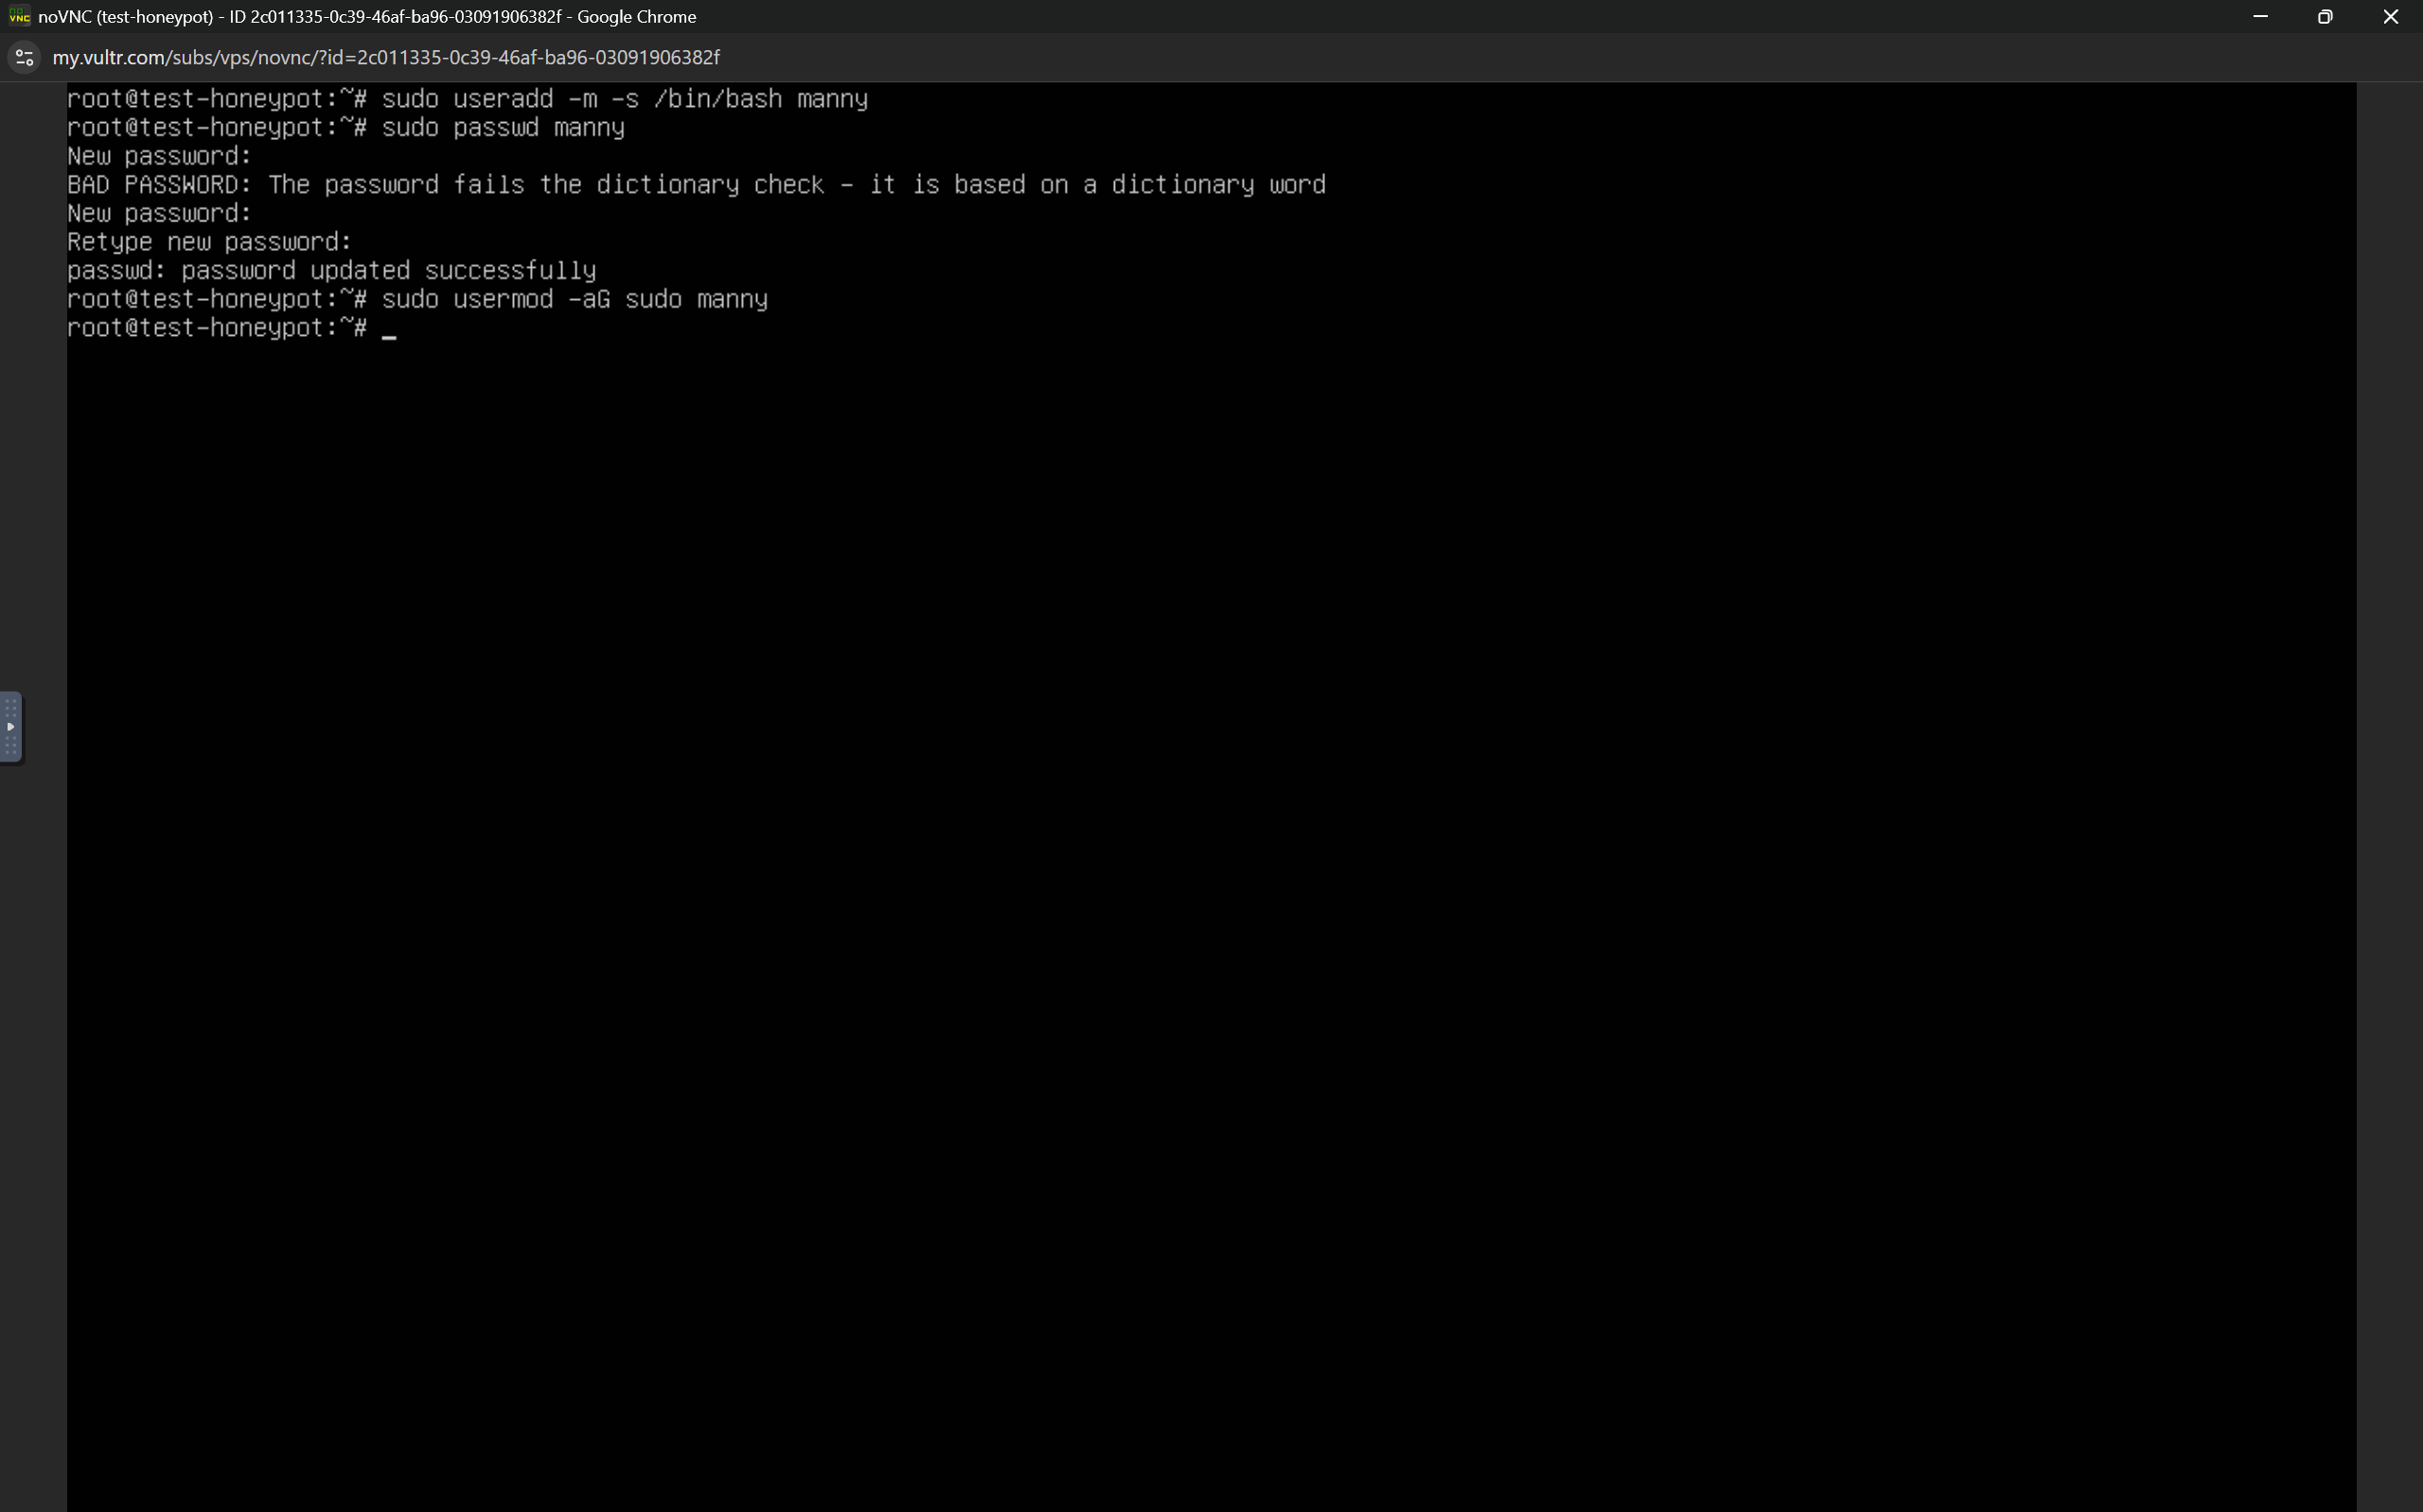
After logging in to theconsole, Run the commands below to add a user, this will be needed in installing TPot. In my case, I chose manny as the user for this purpose.
#This add the user, substitute username with preferred username

sudo useradd -m -s /bin/bash <username>

#Set the password for newly created user
sudo passwd <username>

#Add sudo privileges to the user
sudo usermod -aG sudo <username>
#Switch over to newly created user
sudo su <username>

#Install curl as it would be needed in next step
sudo apt install curl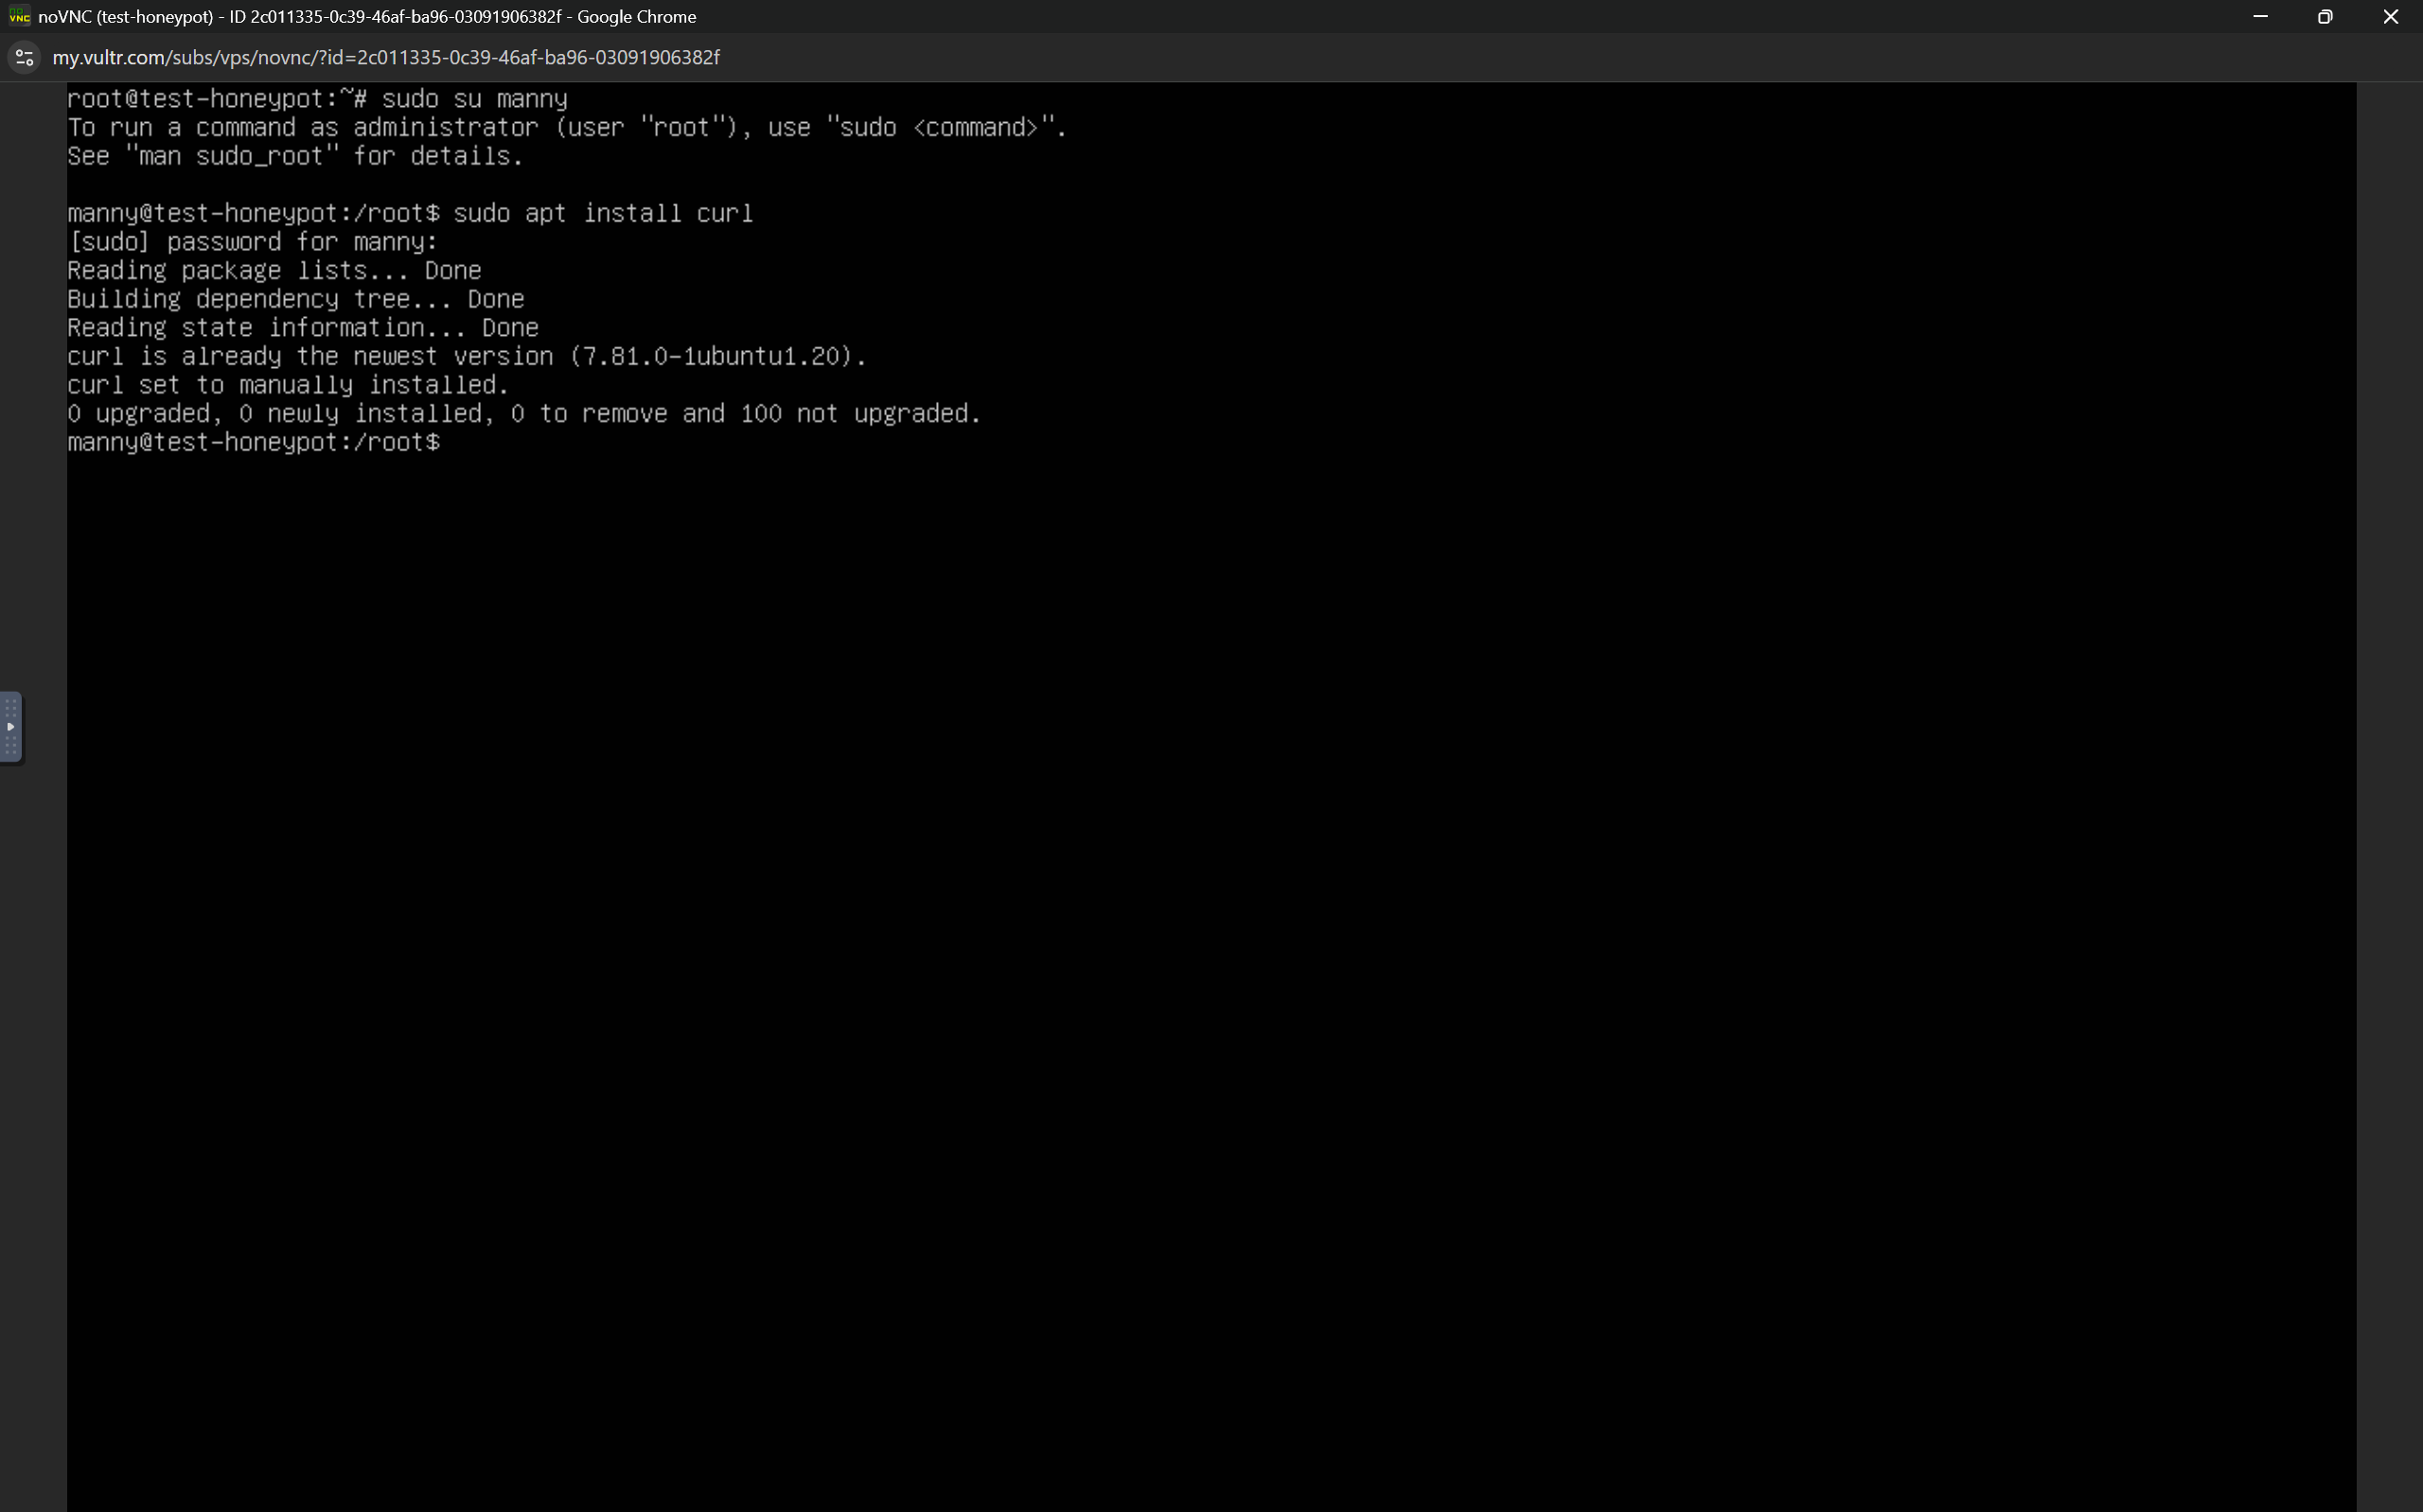
This user(manny) would perform the T-Pot installation to avoid root-based execution issues.
Installing T-Pot CE (Community Edition)
After running the commands in the previous step, you can switch to the new user's $HOME directory and run the T-Pot installer using the commands below;
cd ~
curl -sL https://github.com/telekom-security/tpotce/raw/master/install.sh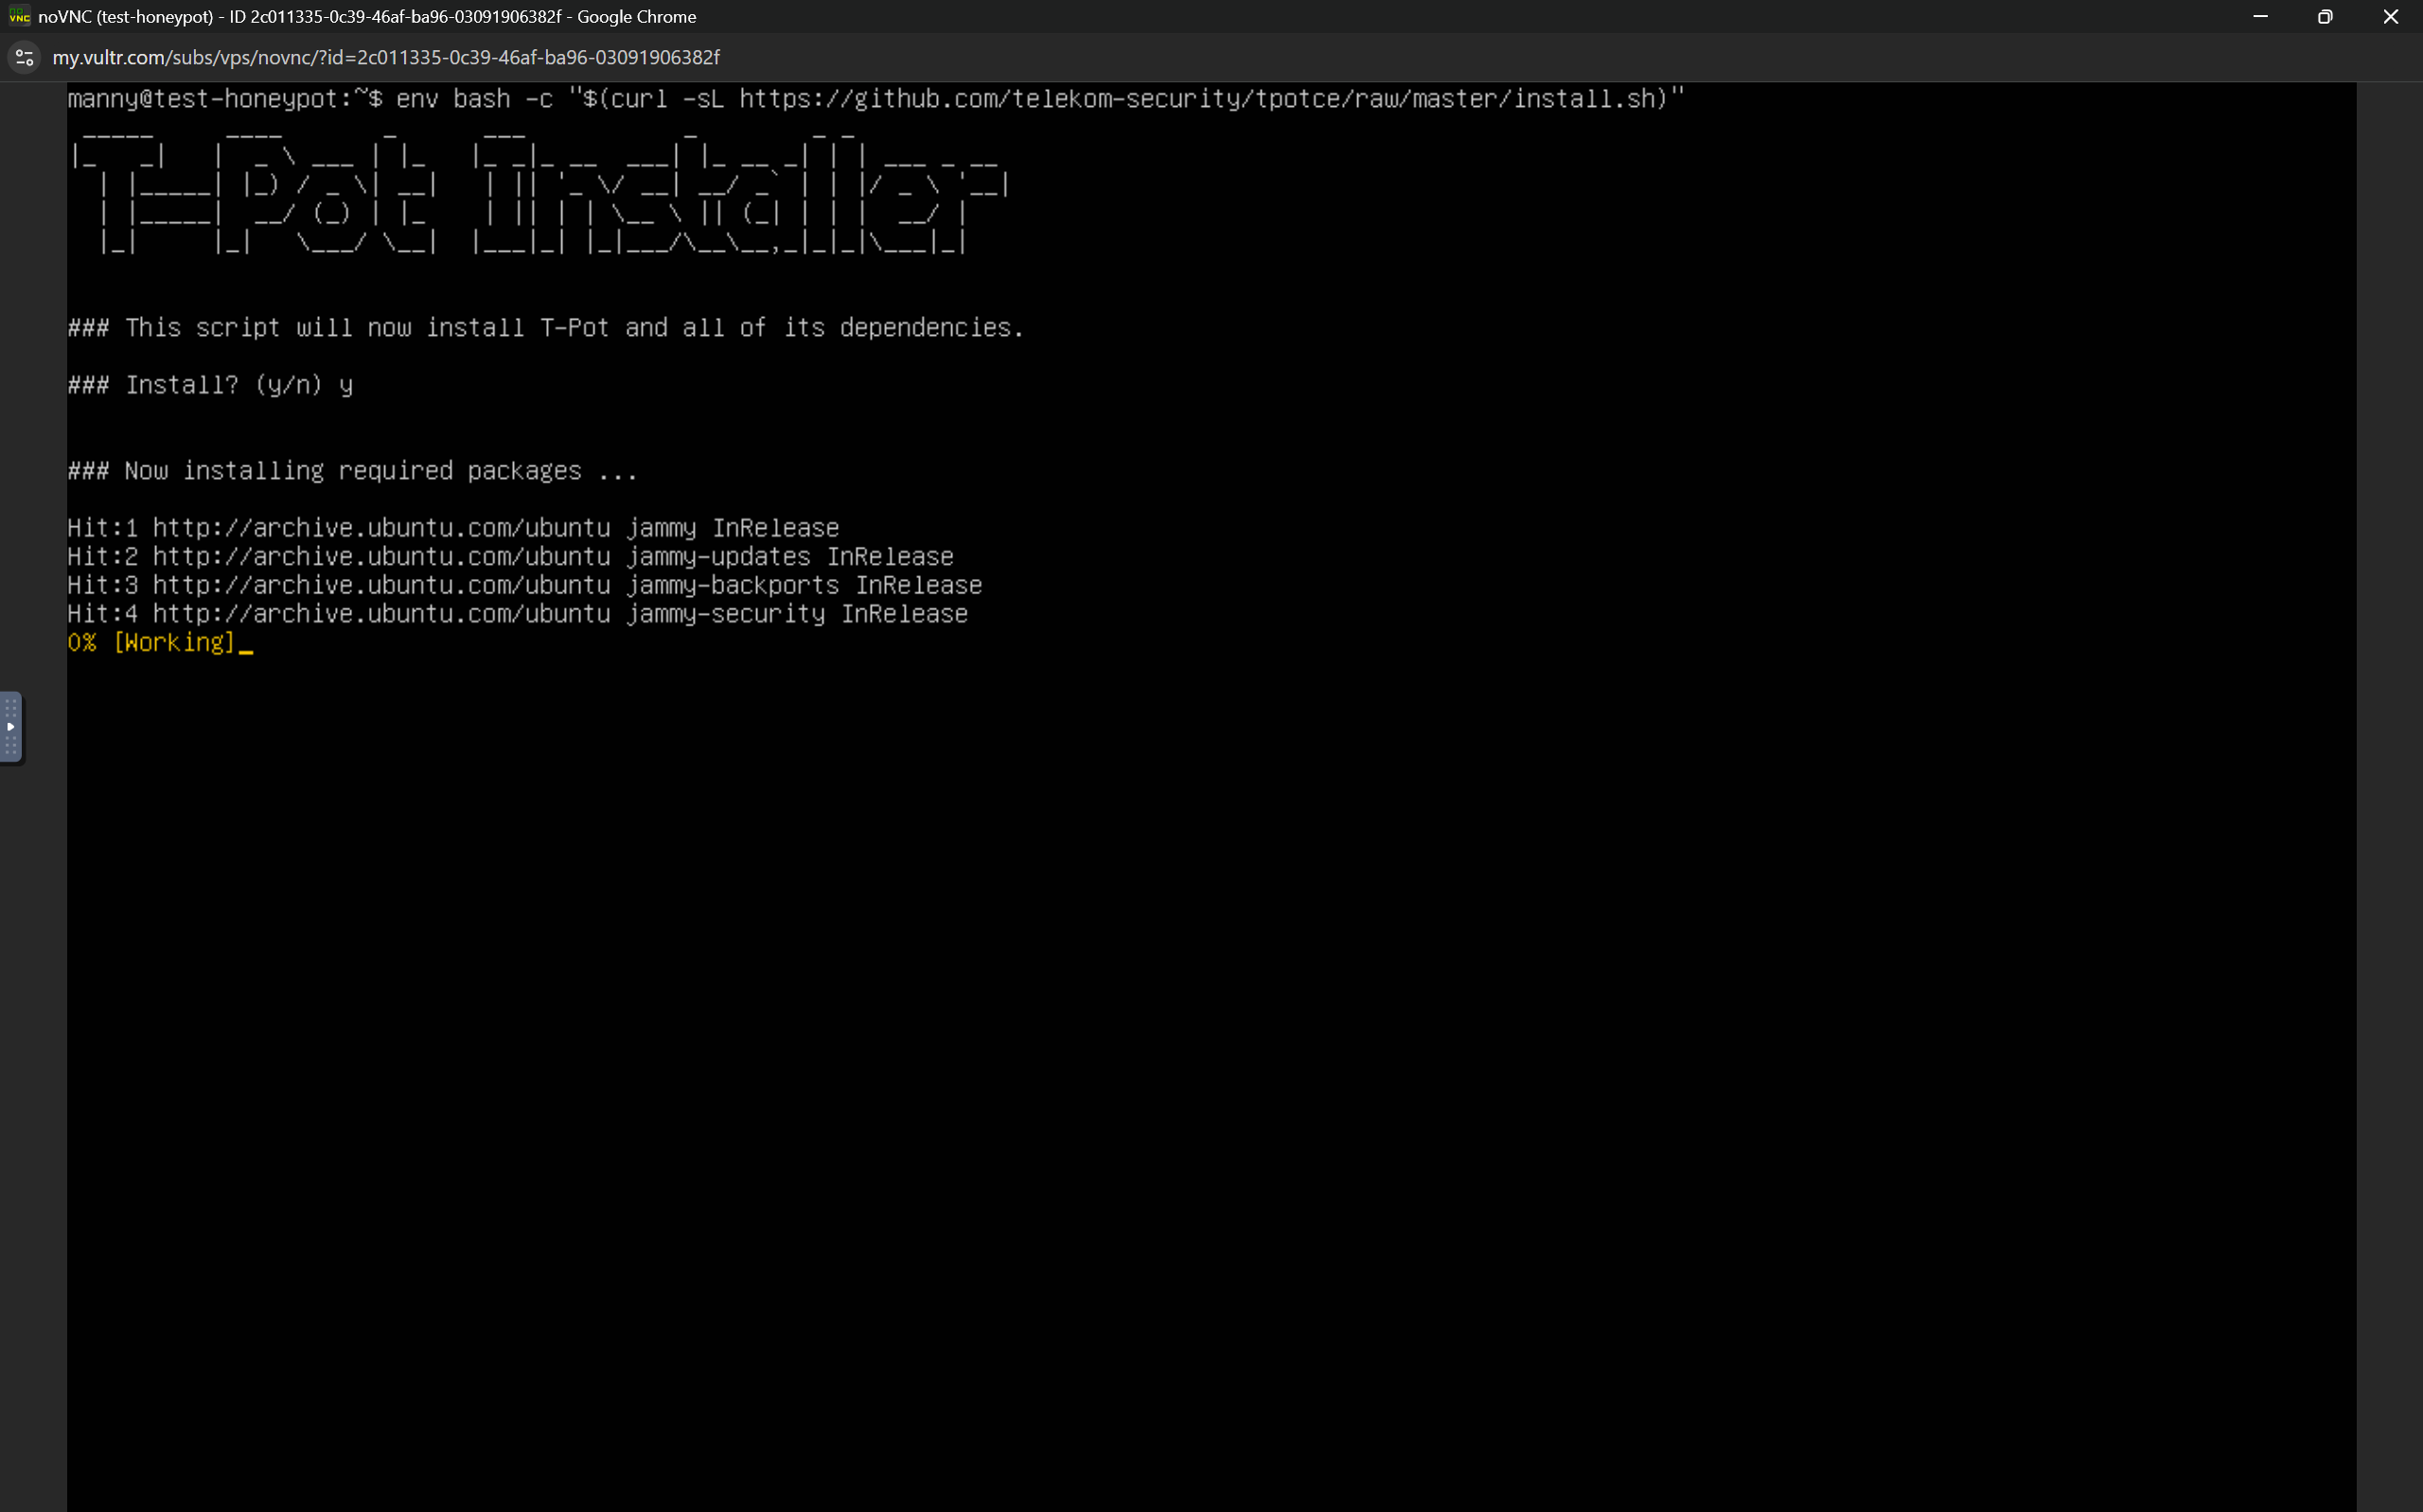
After running the command, press y on the next prompt. See above.
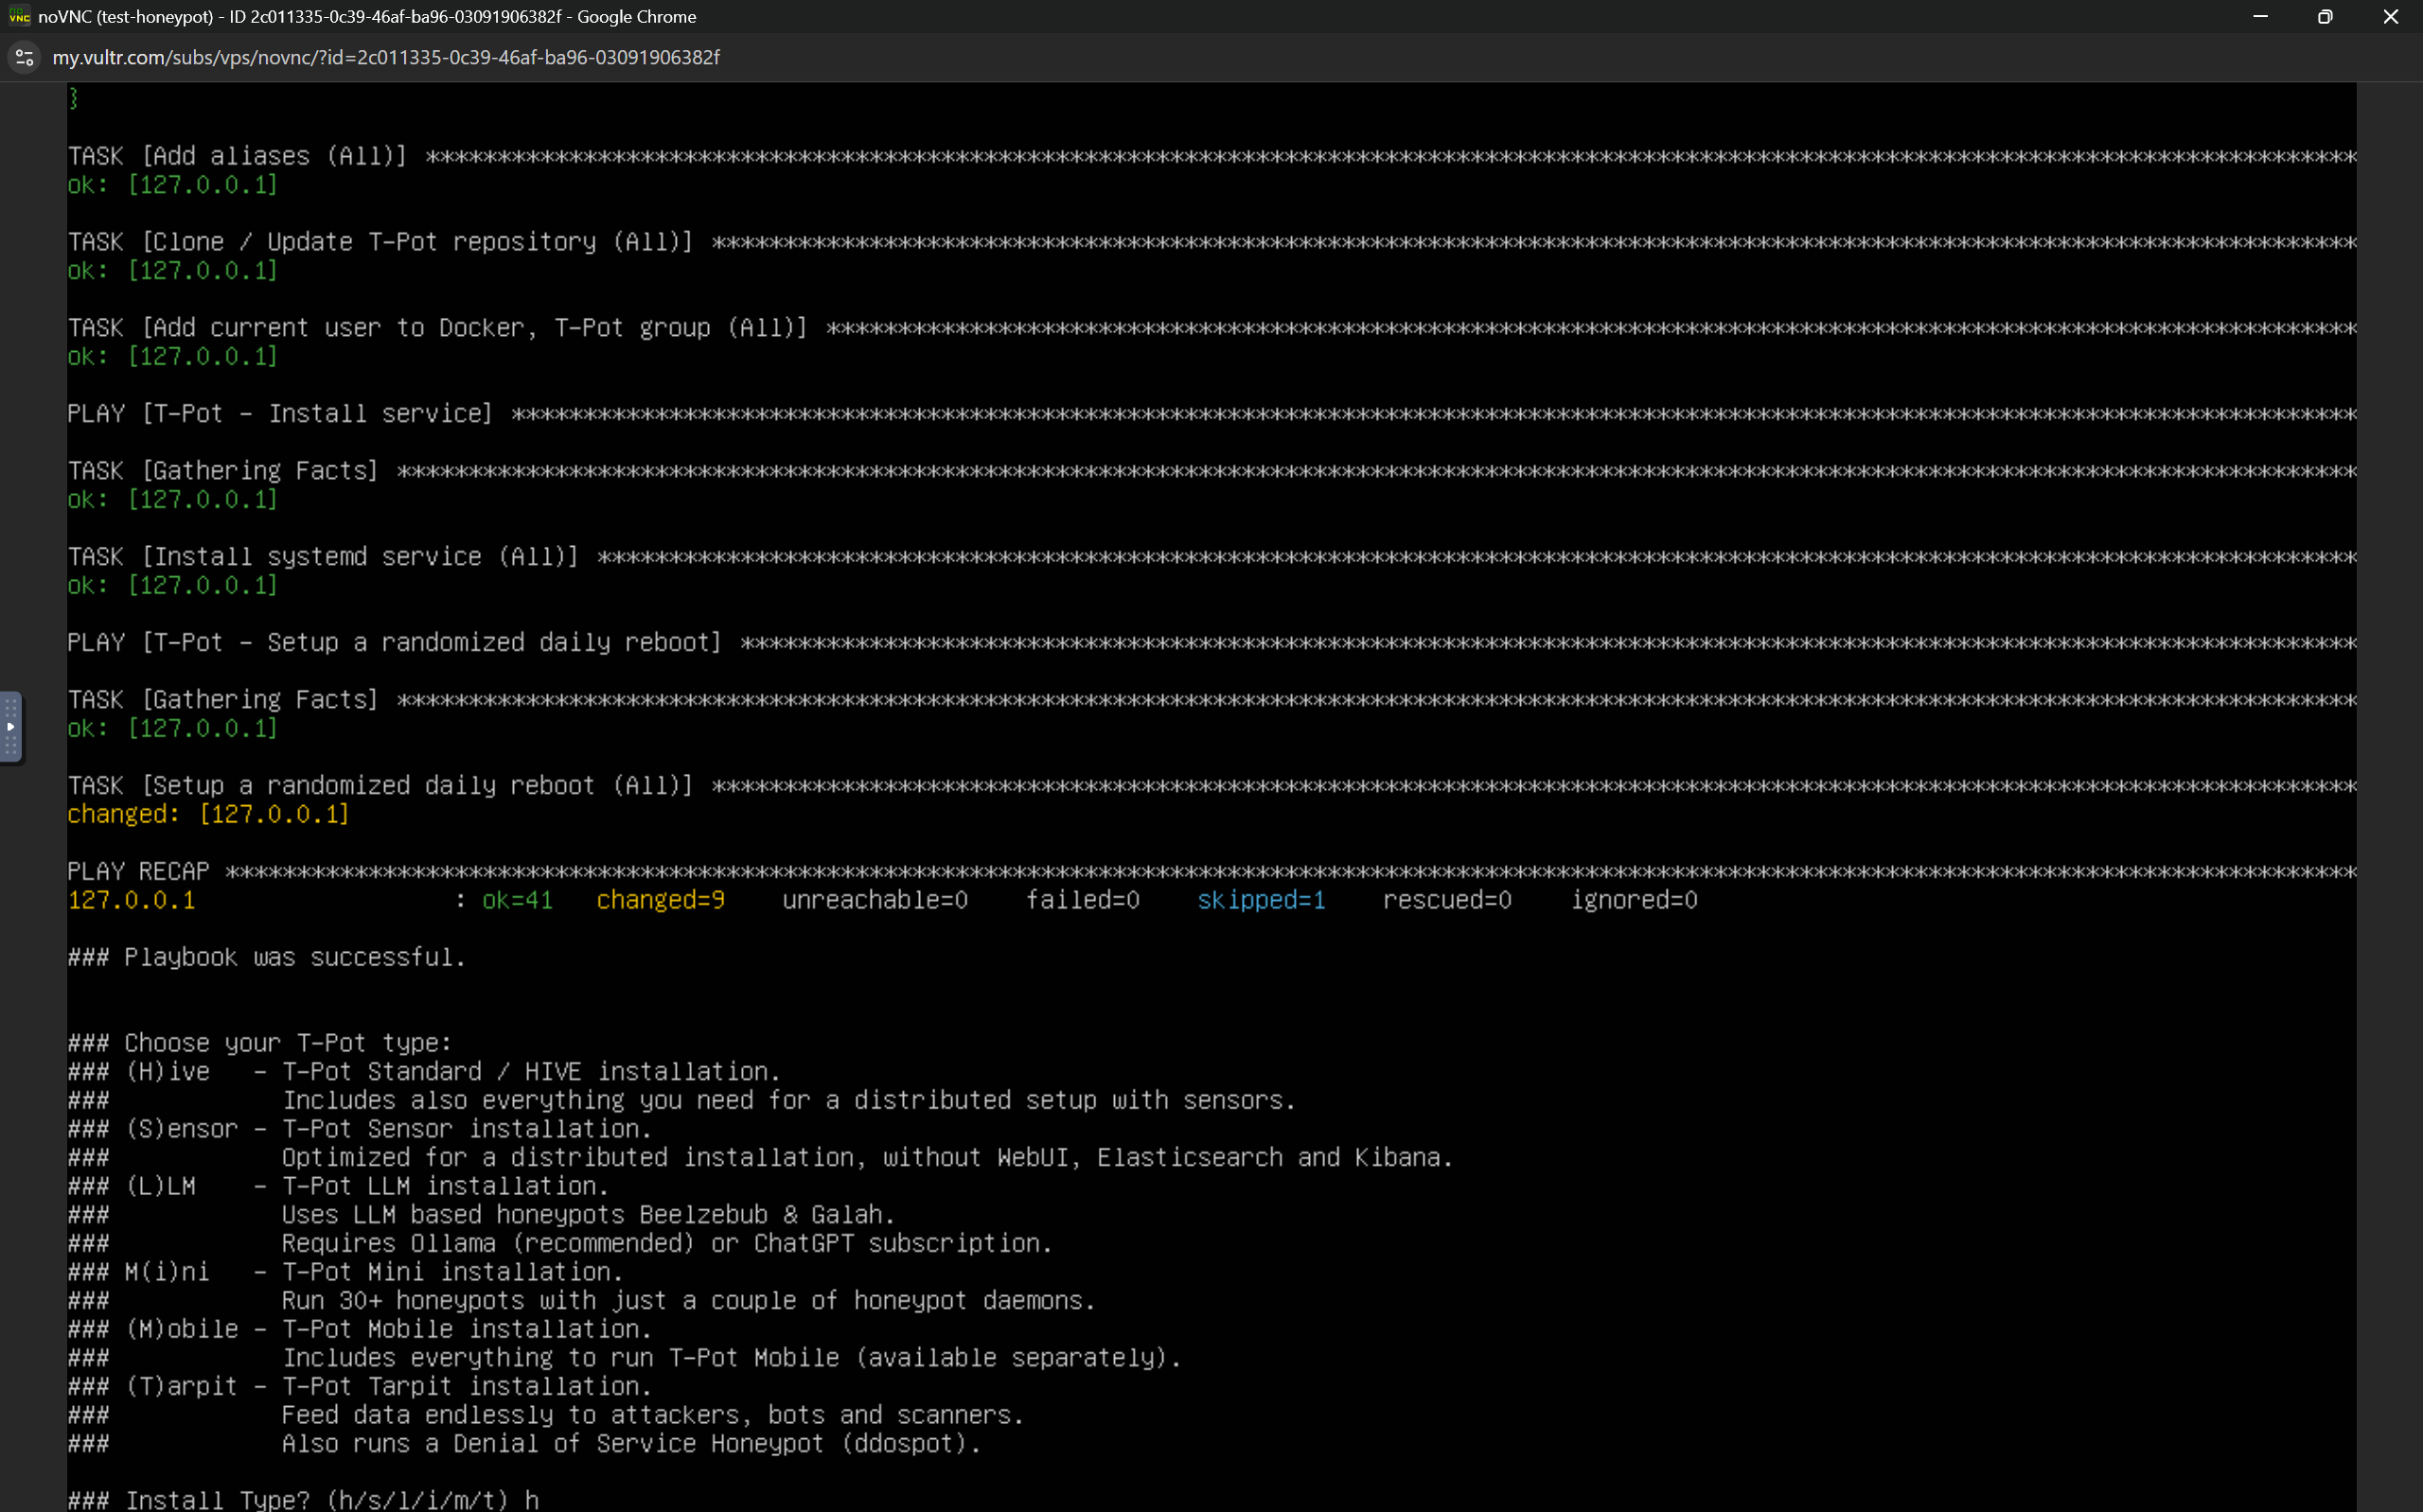
At the second prompt, I selected Hive(h) as my T-Pot type:
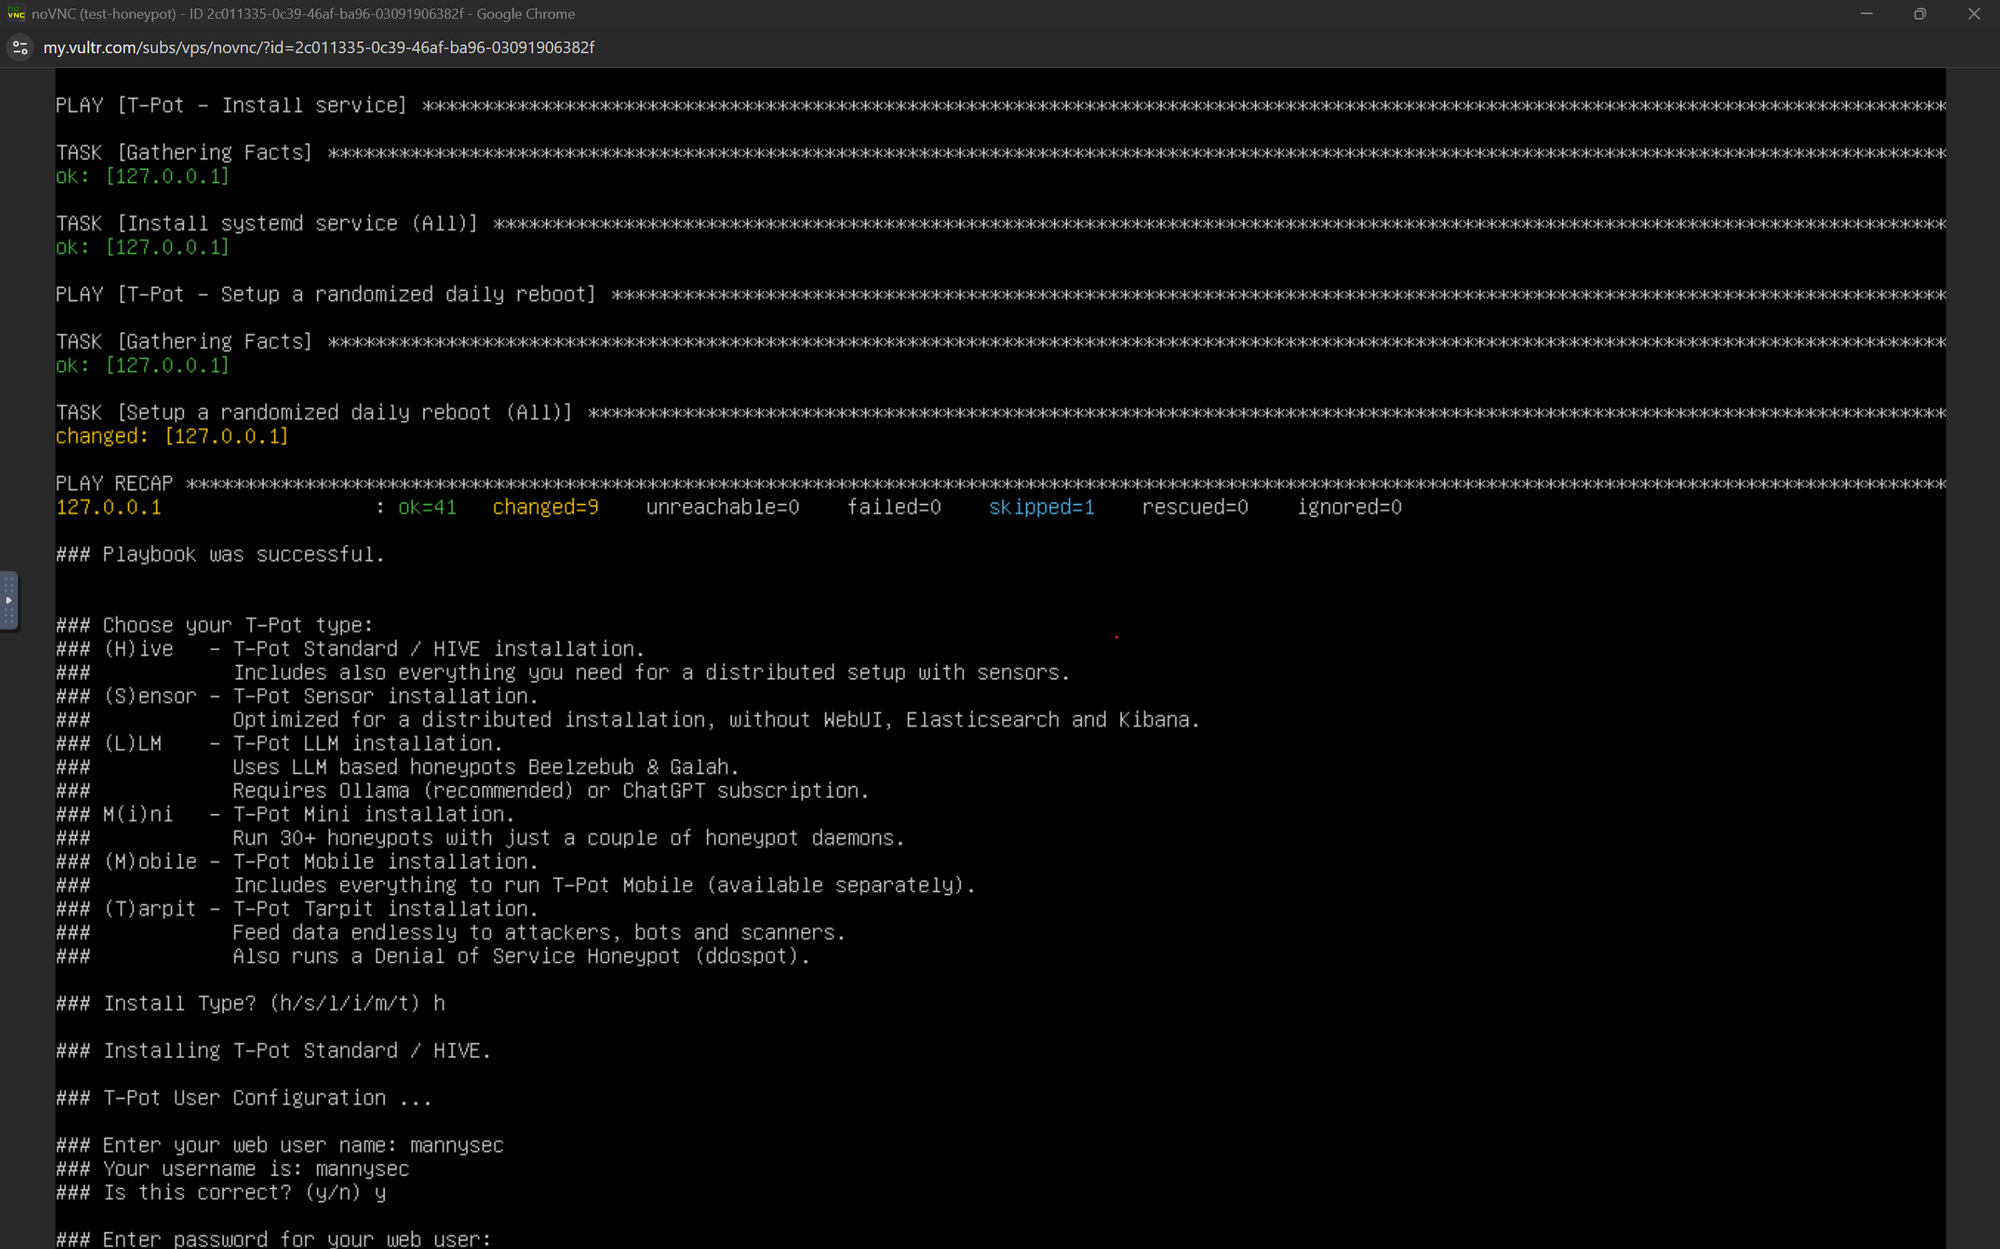
H — Hive: Standard installation with full Elastic + Kibana stack.After installing T-Pot Hive, you will be asked to enter a web user name, I'd recommend it being different from the newly created linux user. I chose mannysec as the username, and set a password following the on-screen prompts. See below.
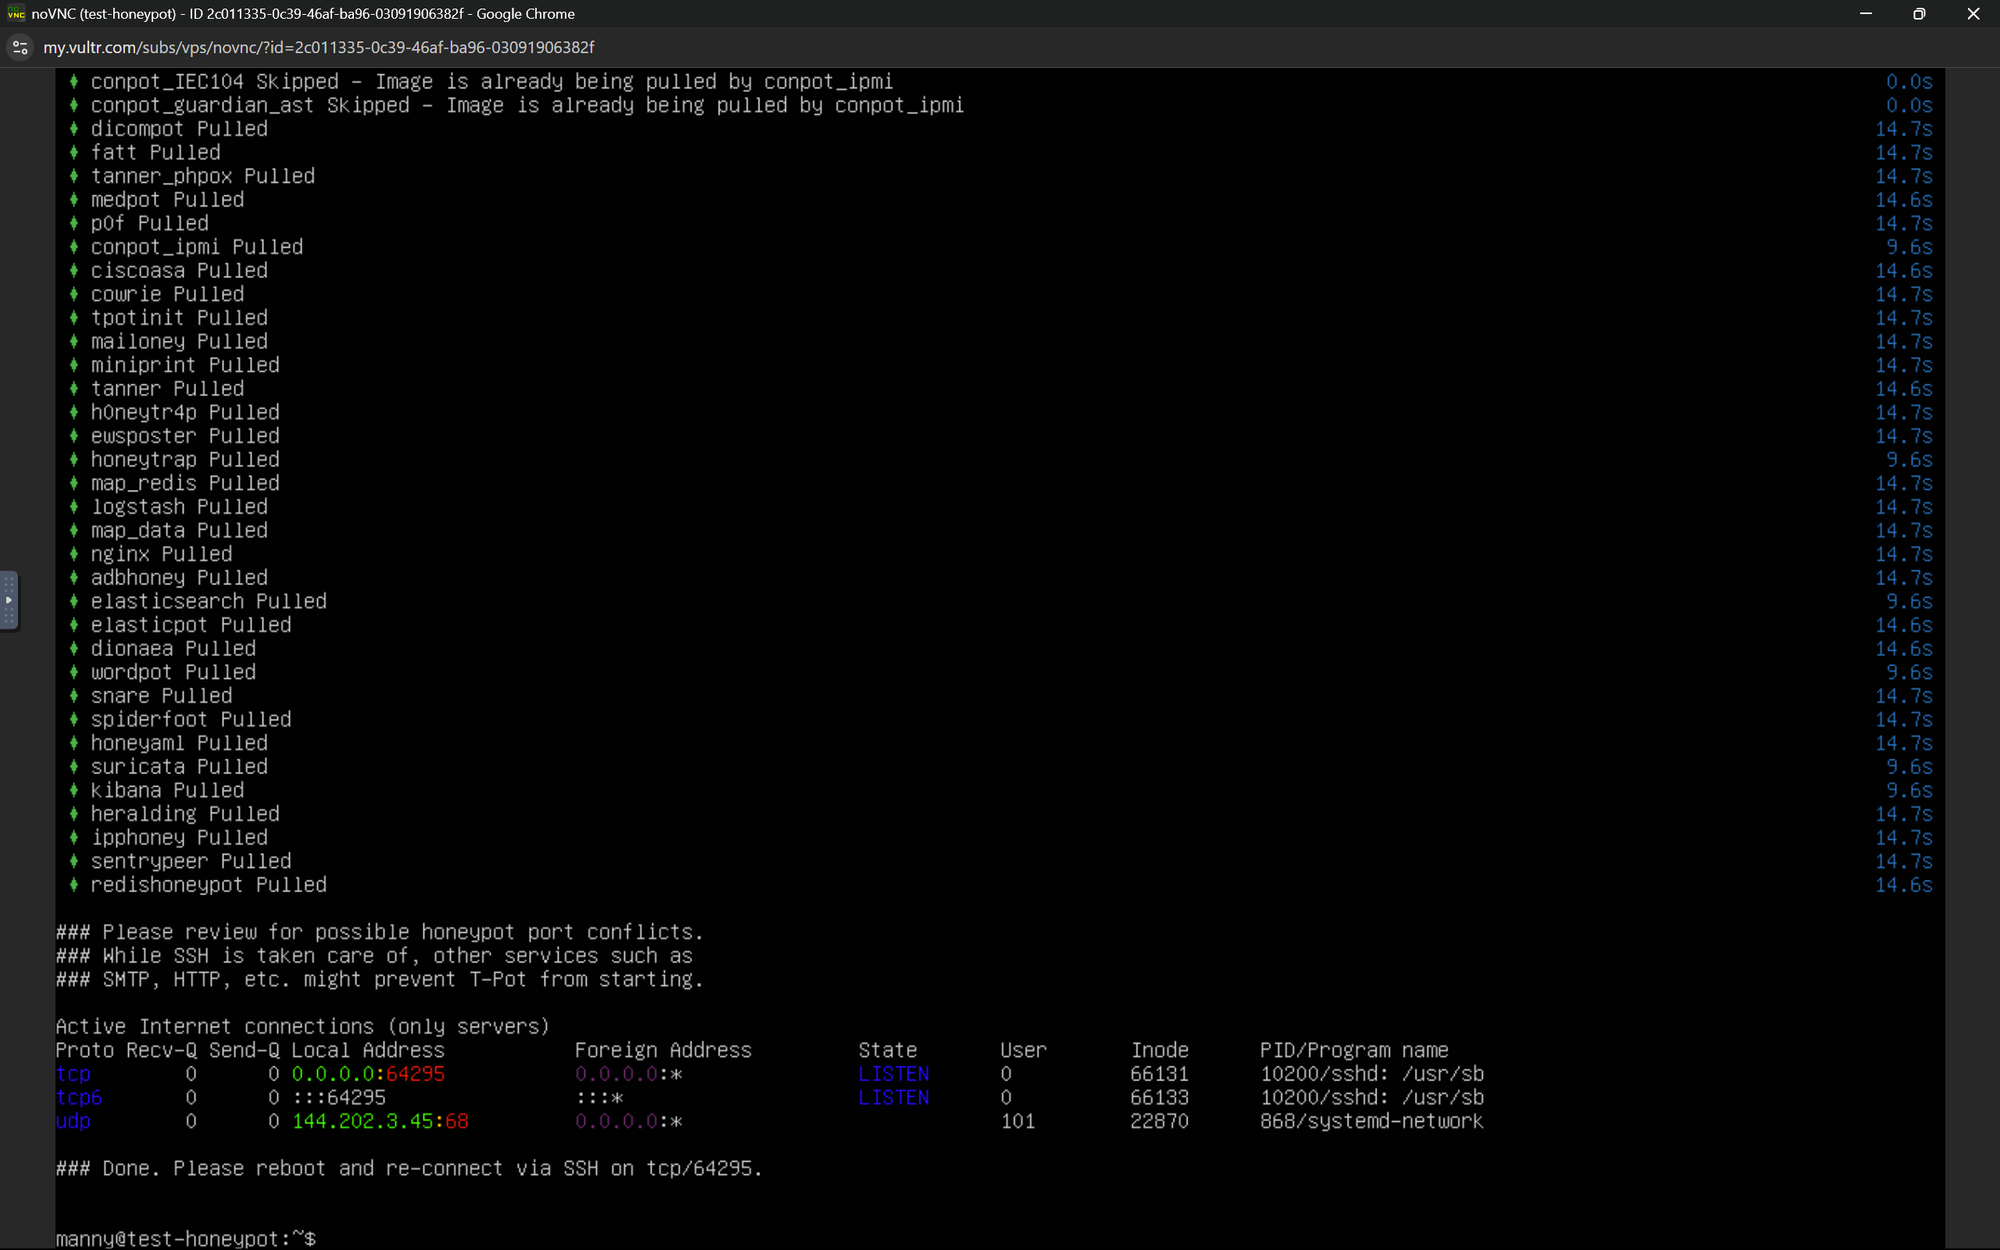
If you see the screen above, it means T-Pot was installed successfully. After this, you can reboot the machine and move to the next step, using the reboot command.
Modifying Firewall for Public Access
After setup and reboot, I explored the dashboards. Before that I made some modifications to our firewall group policy the cloud instance would be accessible anywhere across the internet and the admin panel only from my home network;
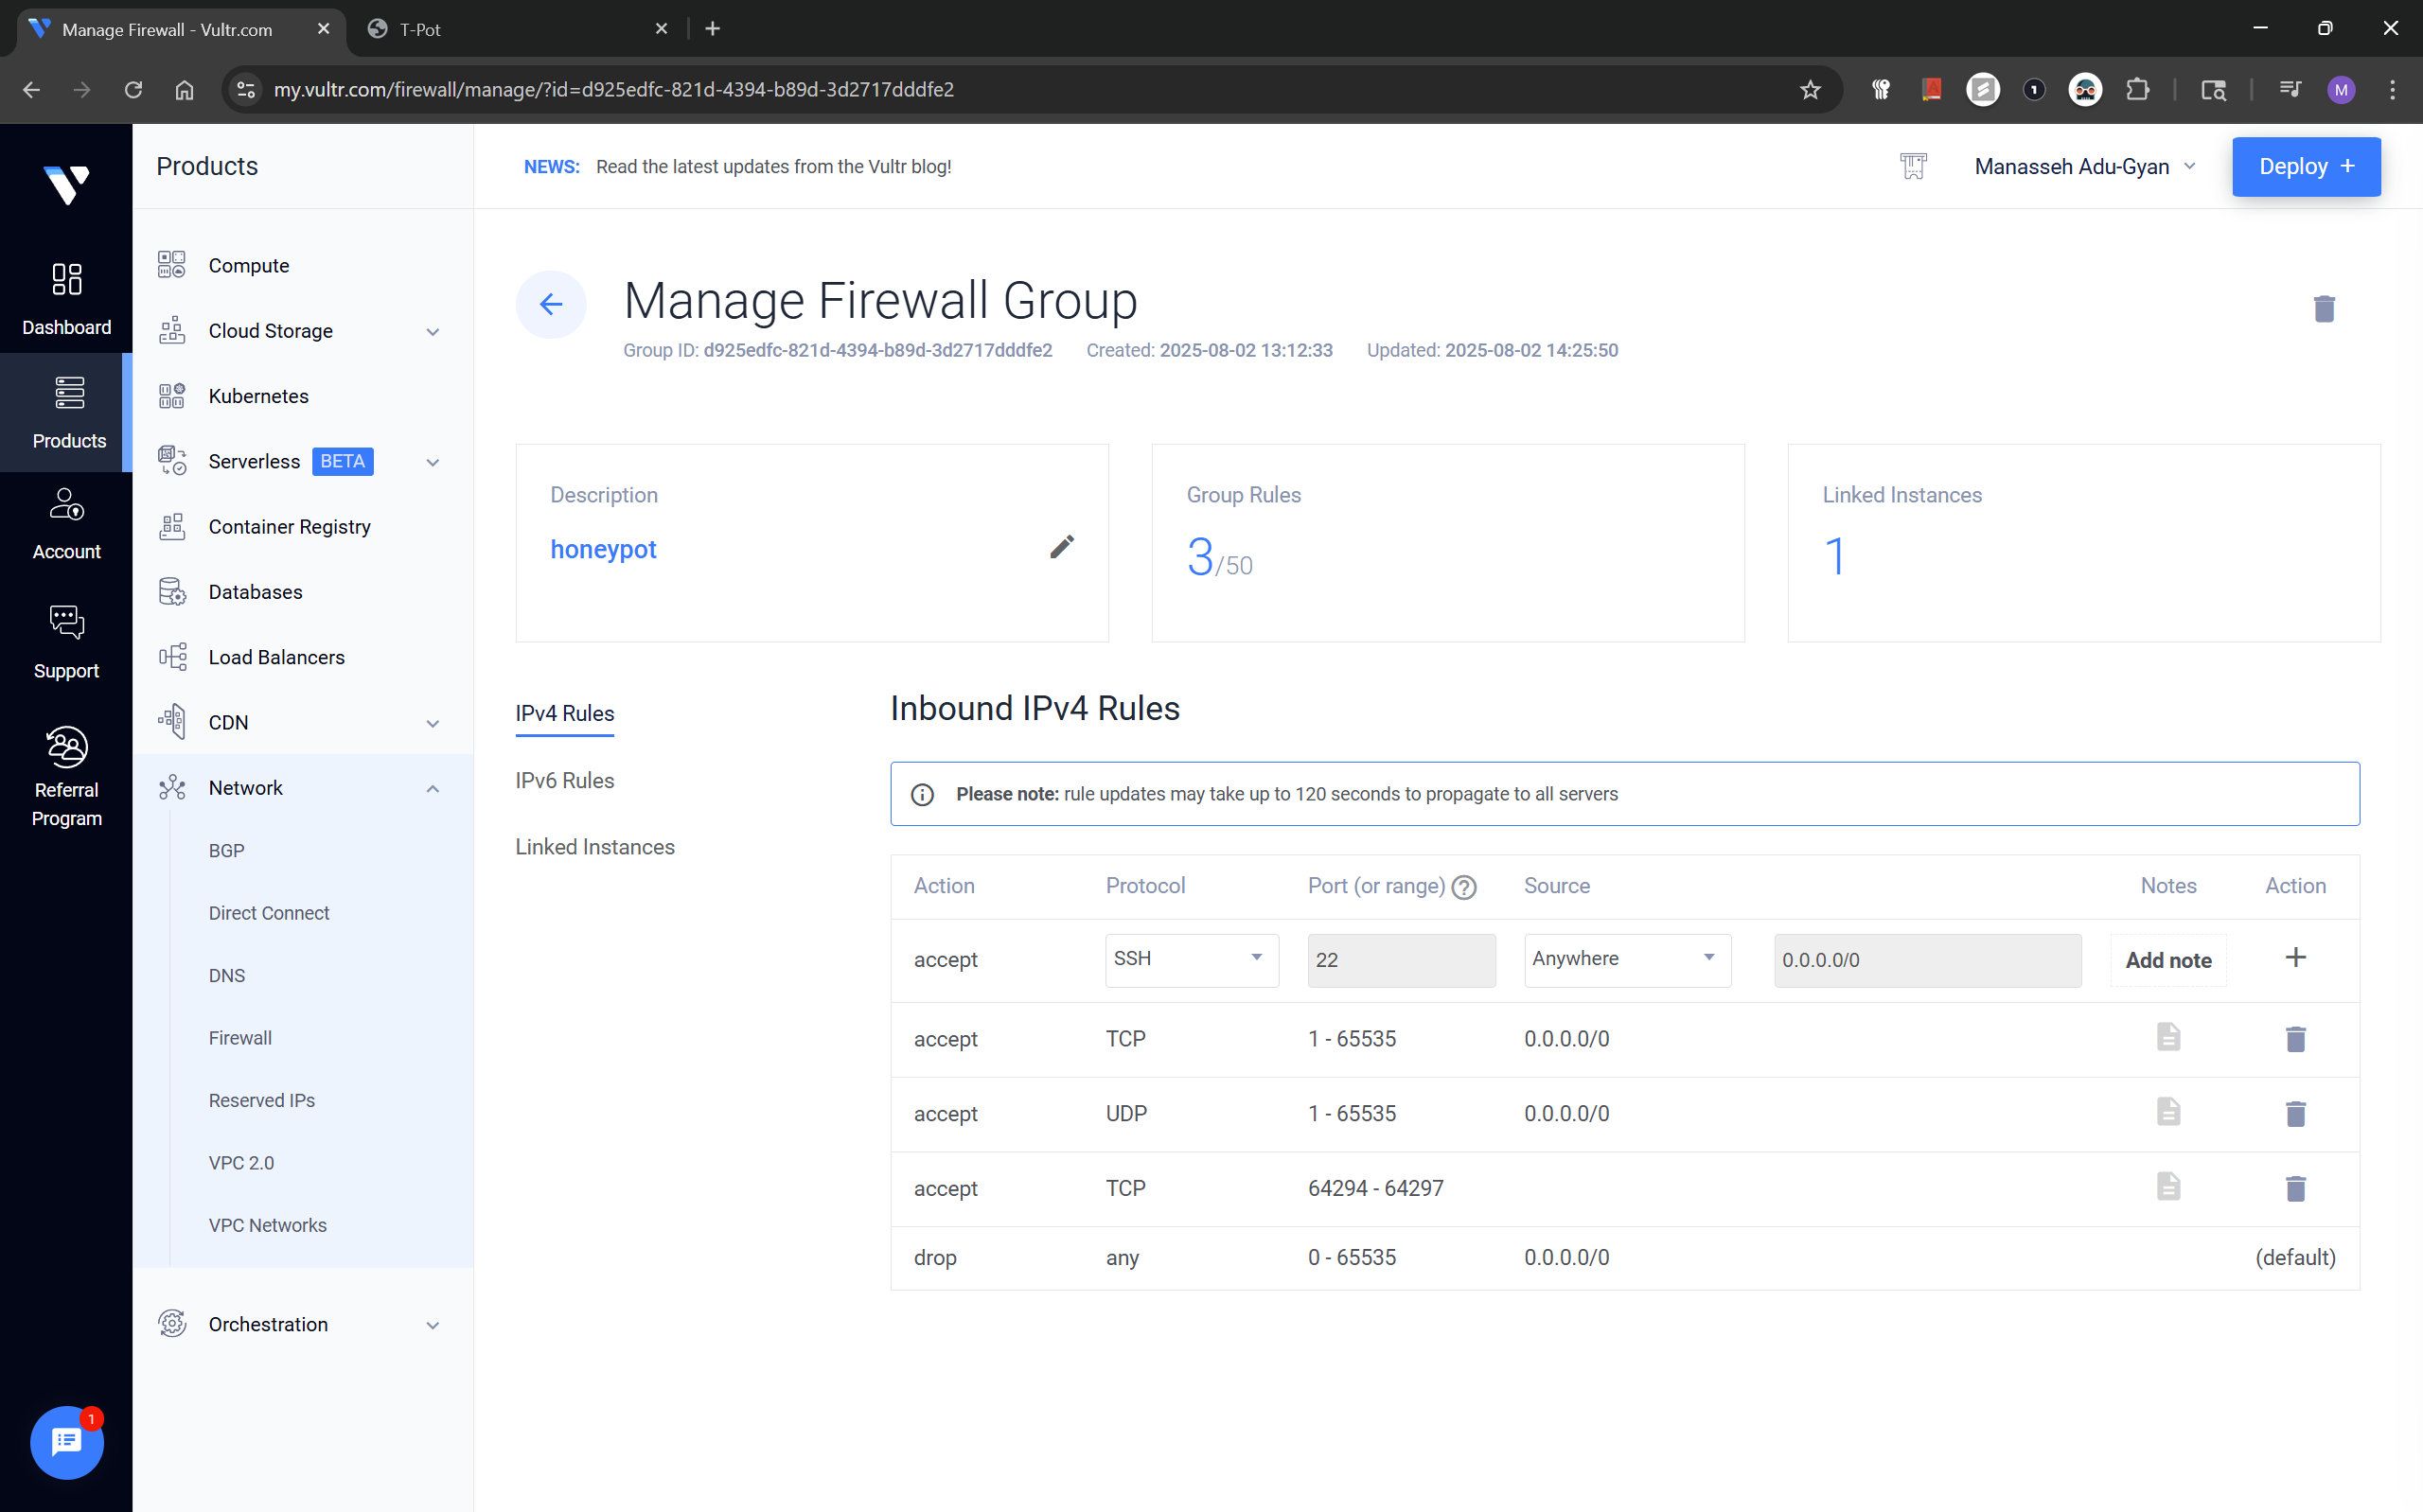
You can navigate back to your firewall group, using Network > Firewall from the sidebar. You'd have to delete the rule entries from before and add the ones below.
Firewall Rules
- All TCP & UDP Ports (1–65535) – Allowed from anywhere
- TCP Ports 64294–64297 – Allowed only from
My IP
Accessing Real-Time Attack Telemetry
Main T-Pot dashboard:
https://instance-ip:64297/
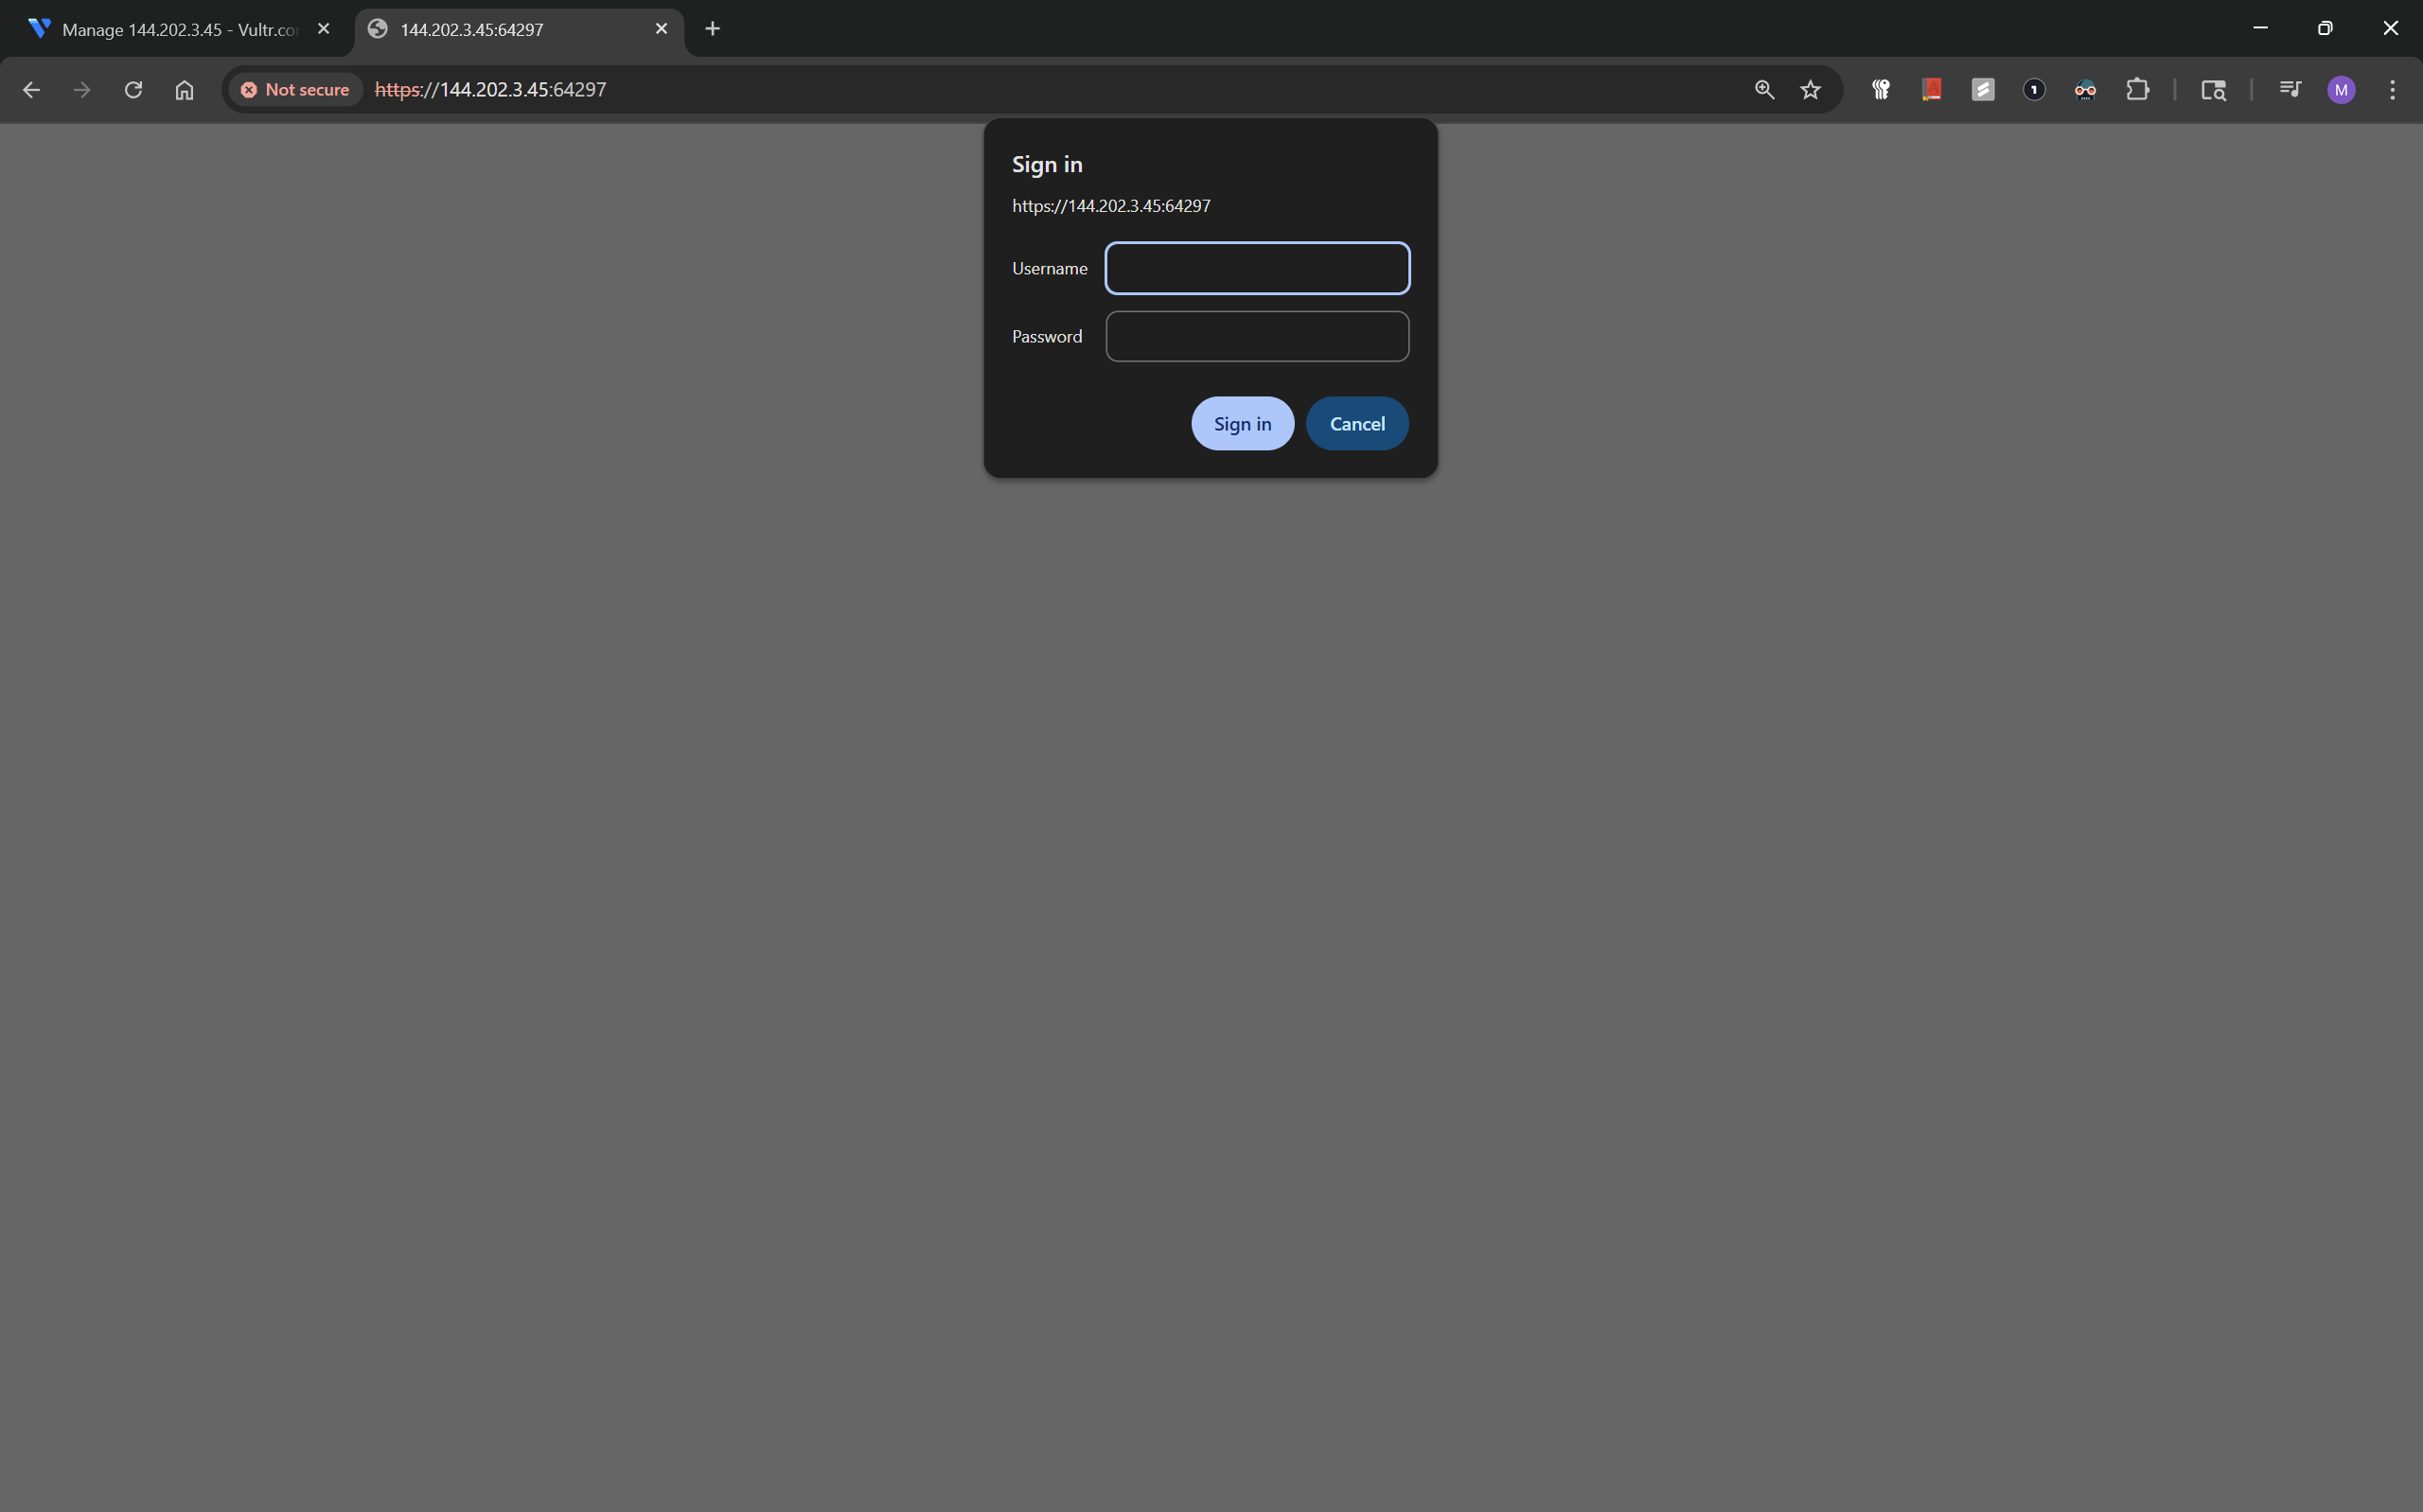
The username to this web application, is the one you set for T-Pot at initialization, after successfully logging in, it should bring you to the screen below;
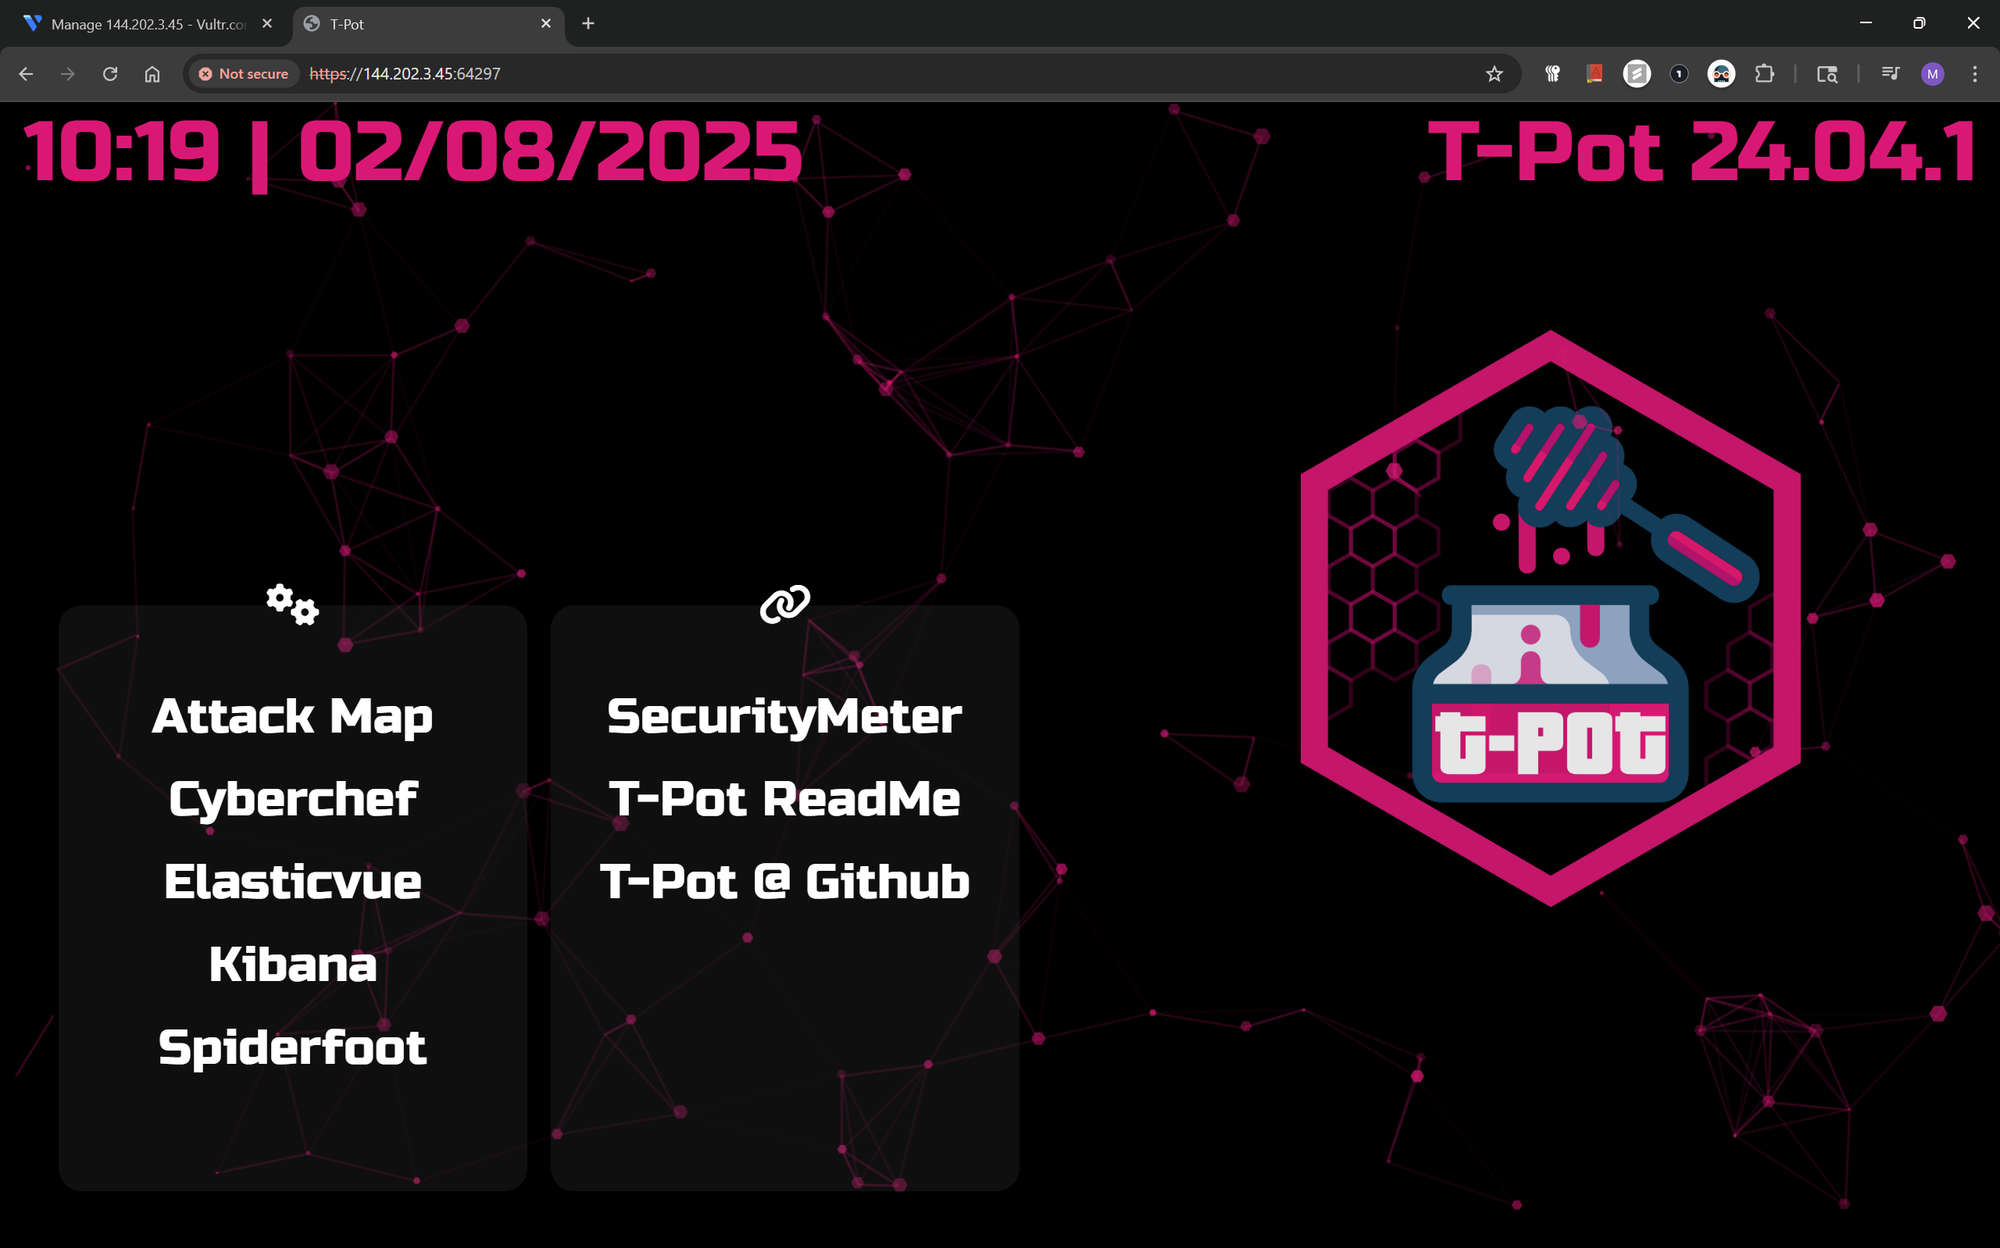
The screen above shows what T-Pot contains, Attack Map, Cyber Chef, Kibana, Spiderfoot, etc.
T-Pot Attack Map
https://instance-ip:64297/map
This interactive map shows global sources of incoming connections across services, this is the screenshot as of nearly 24 hours of running it;
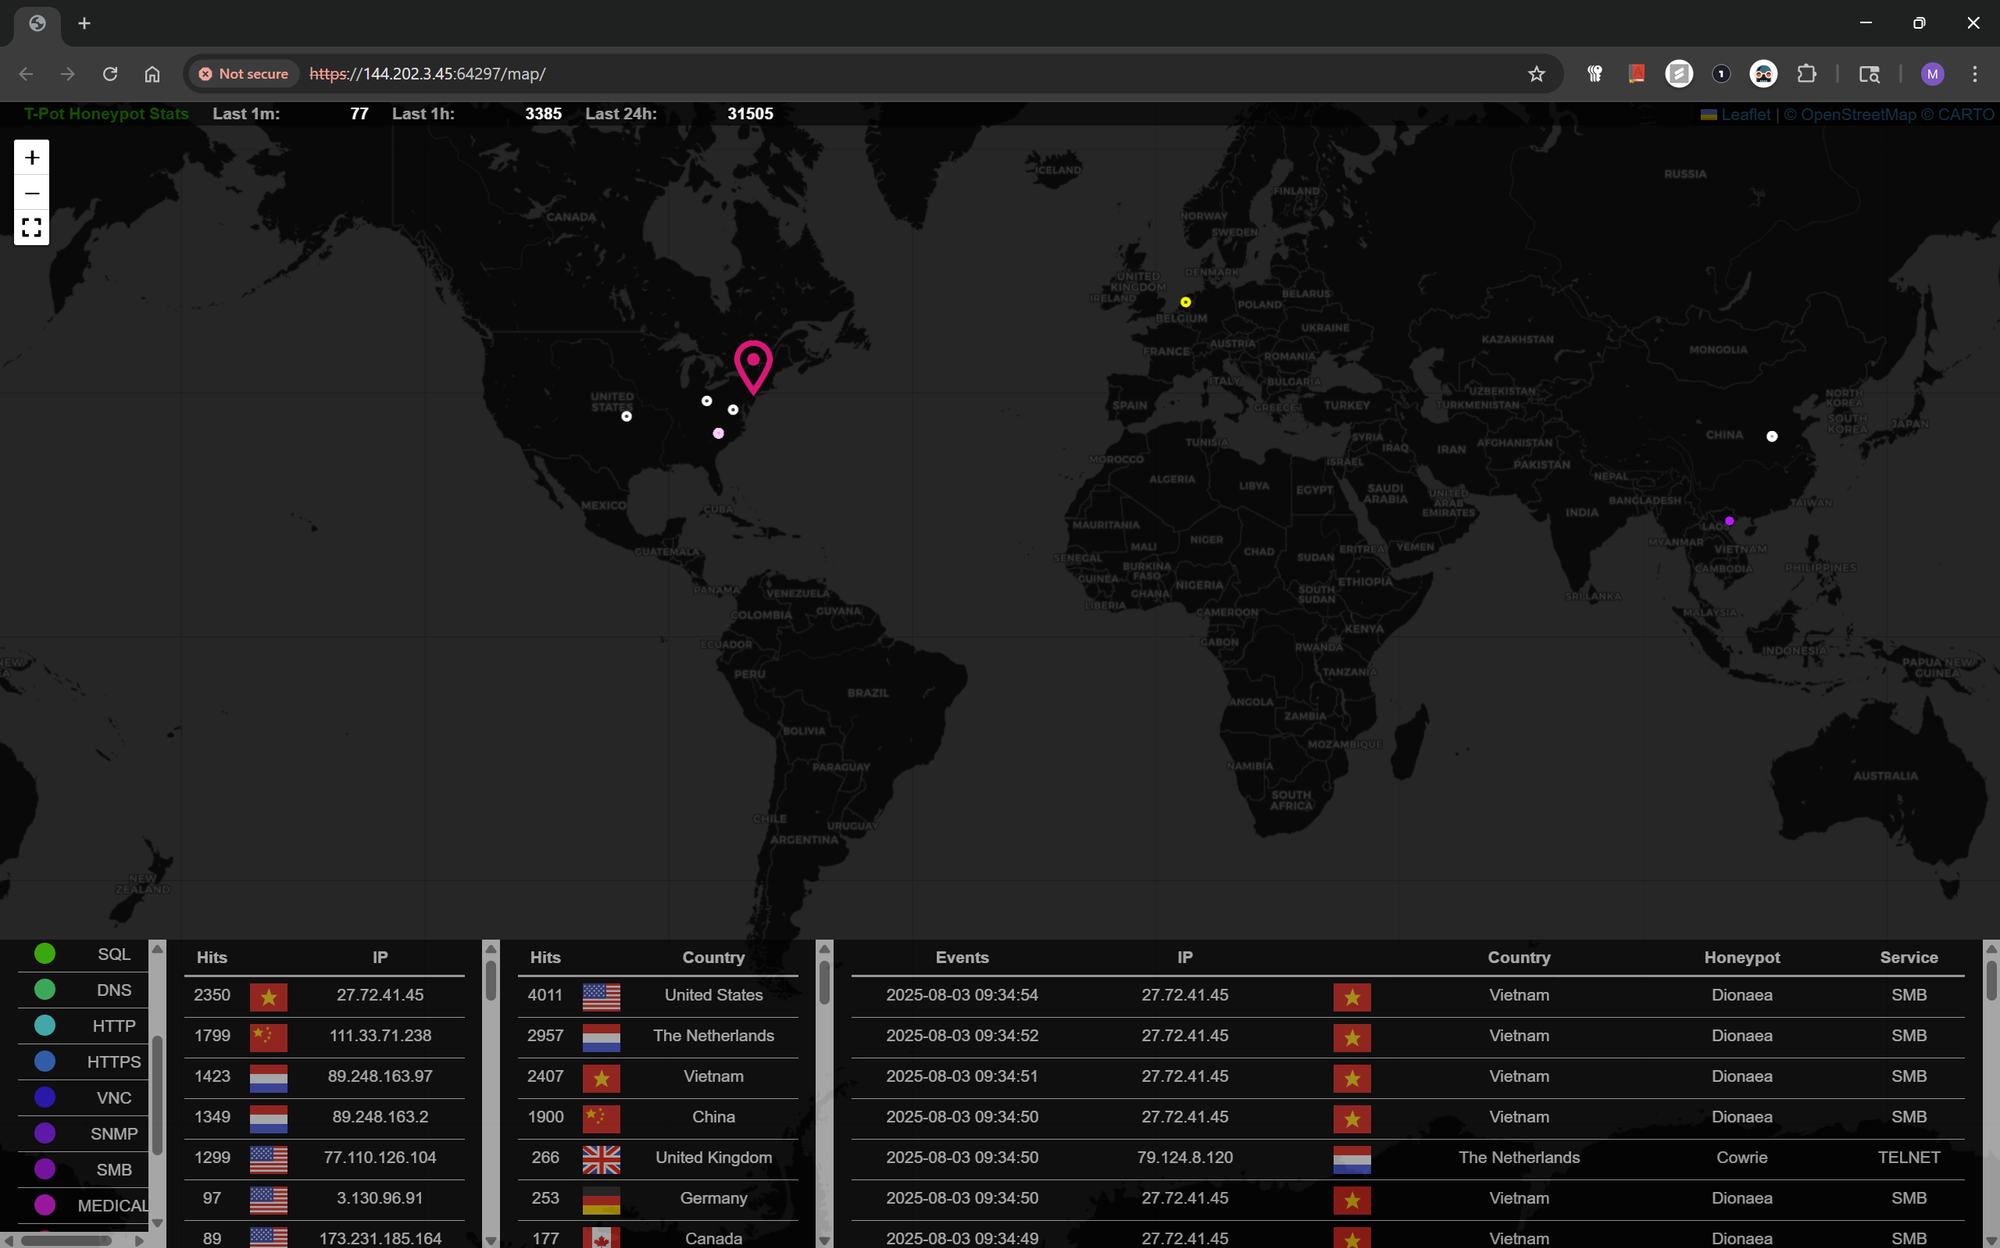
Some interesting stats here, telemetry from all over the world.
Kibana Dashboards
https://instance-ip:64297/kibana
Within Kibana, I selected the Honeytrap dashboard which displayed:
Total attack attempts: As of 18 hours, there we 19k attacks from 2,268 domains on the honeypot.
Top source countries: US, China, Germany, Netherlands
Ports attacked: 8888, 59523, 32483, etc.
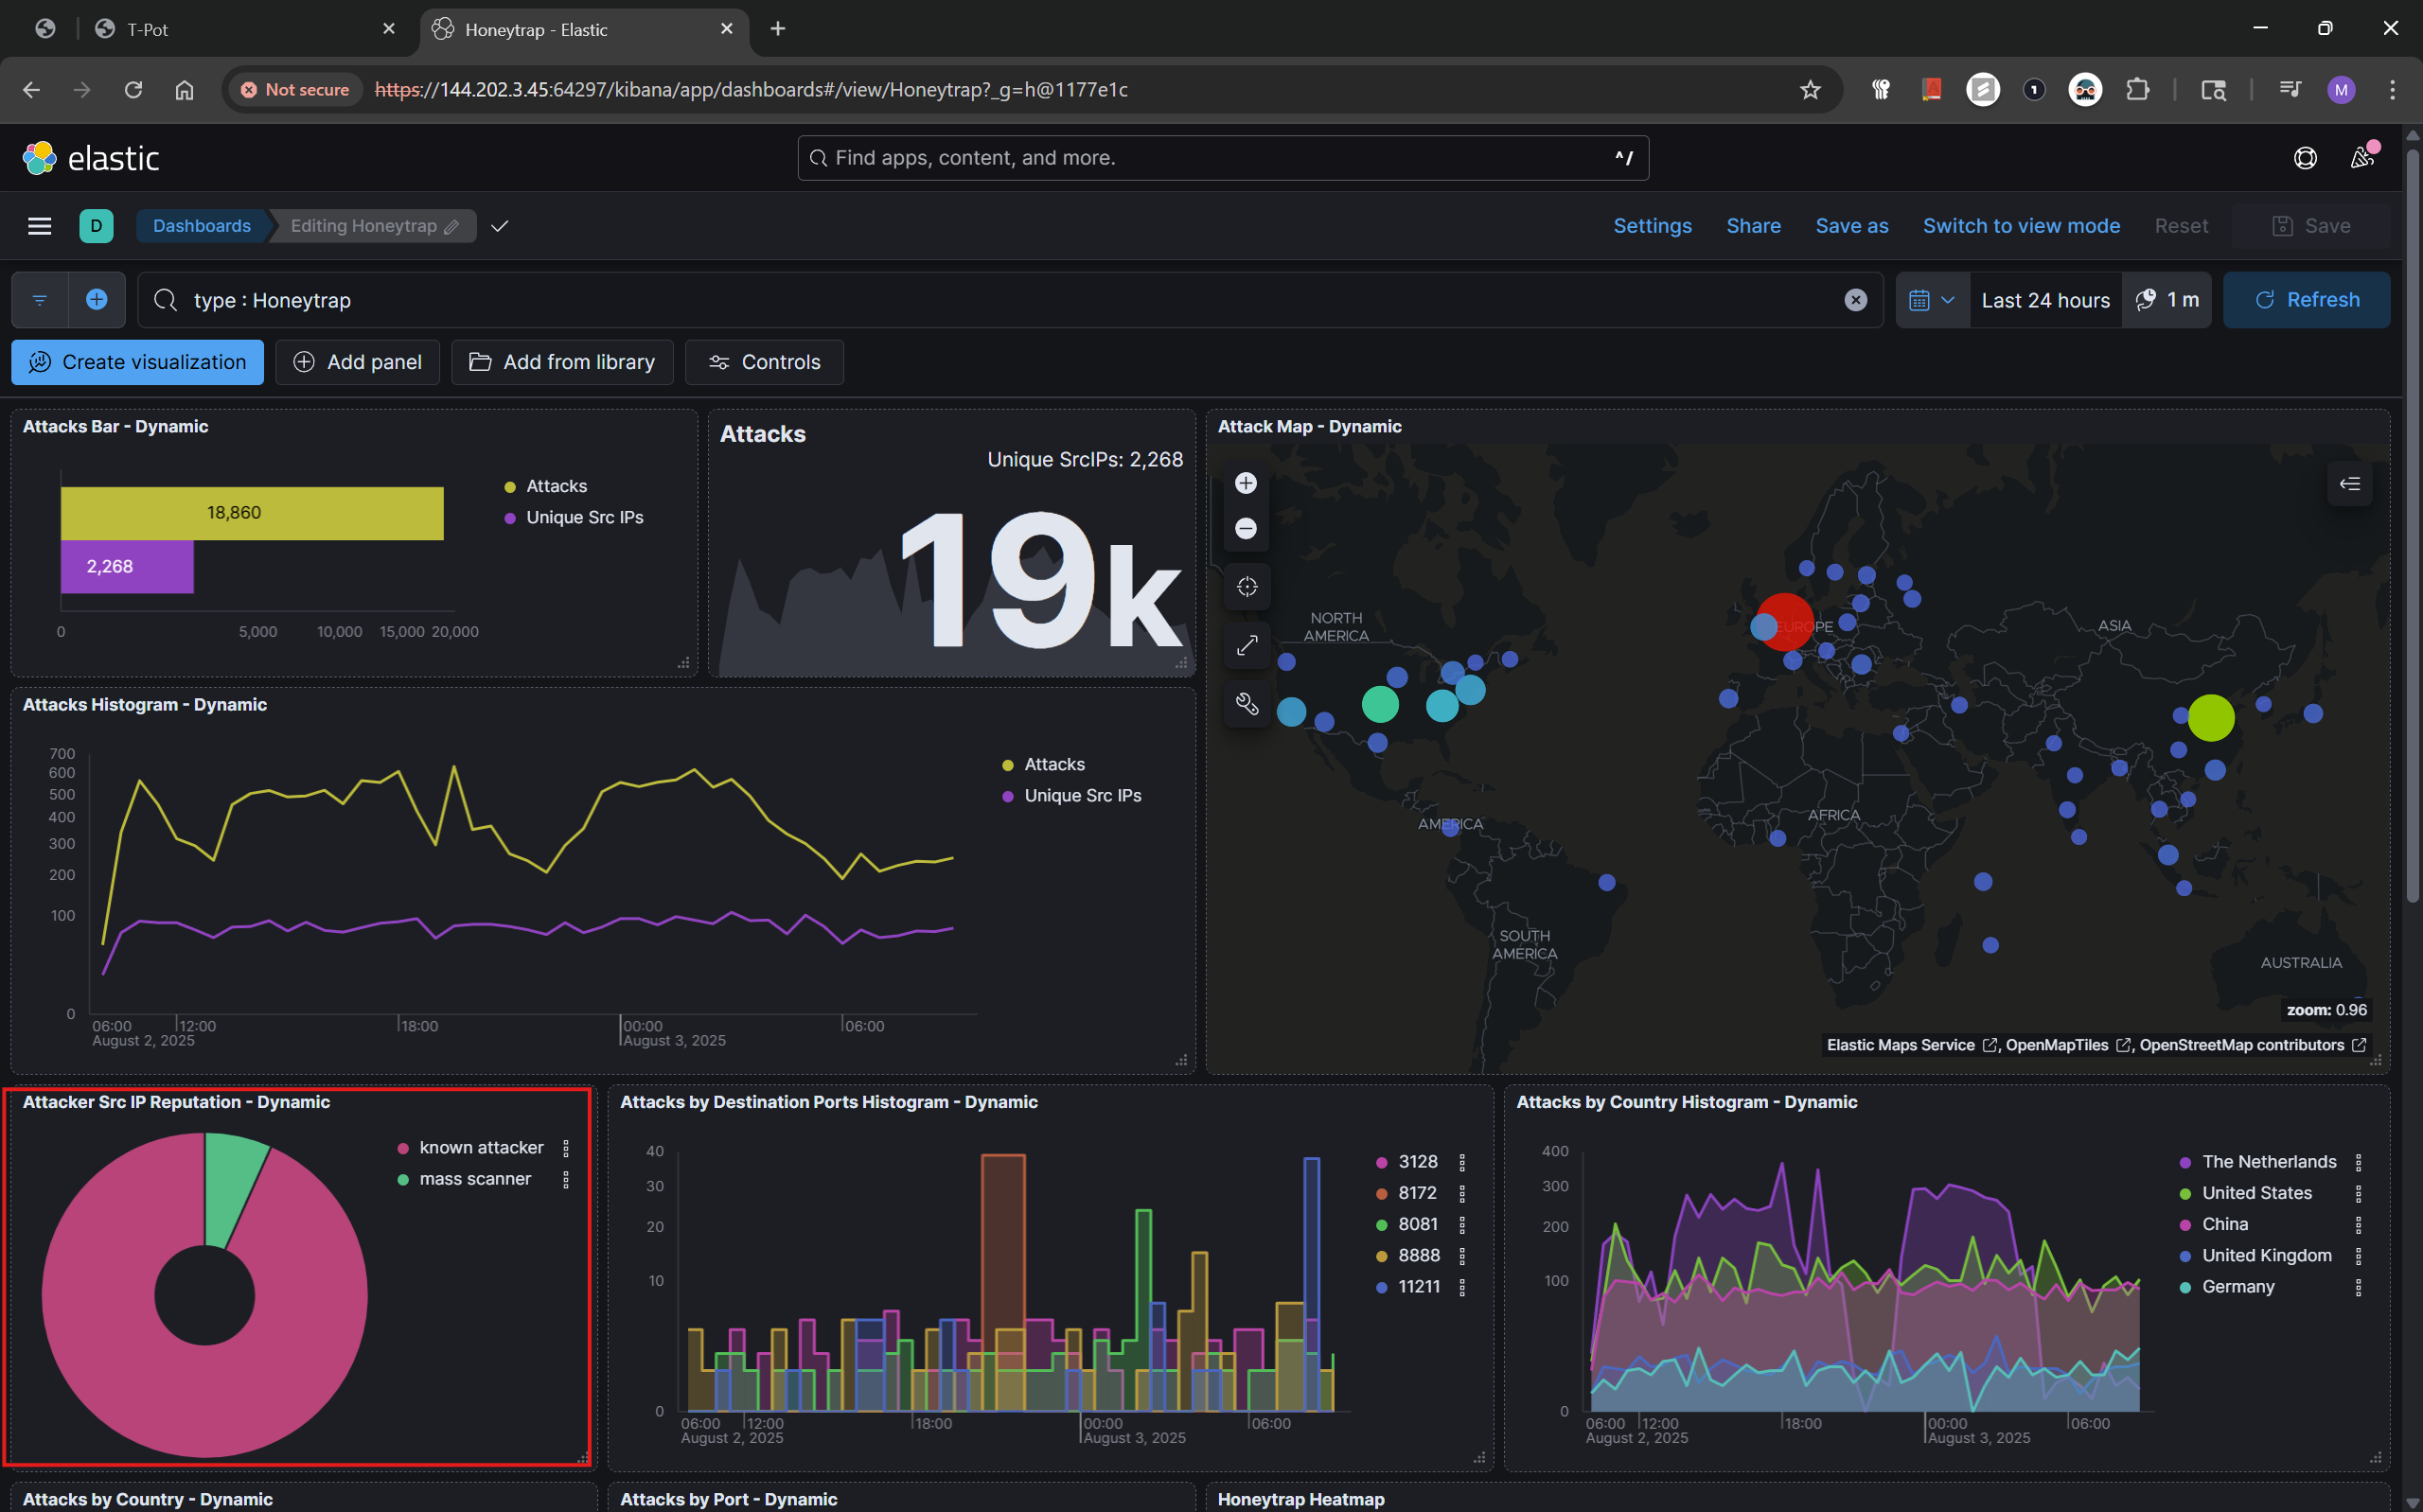
Source IP reputation: mass scanners, known actors
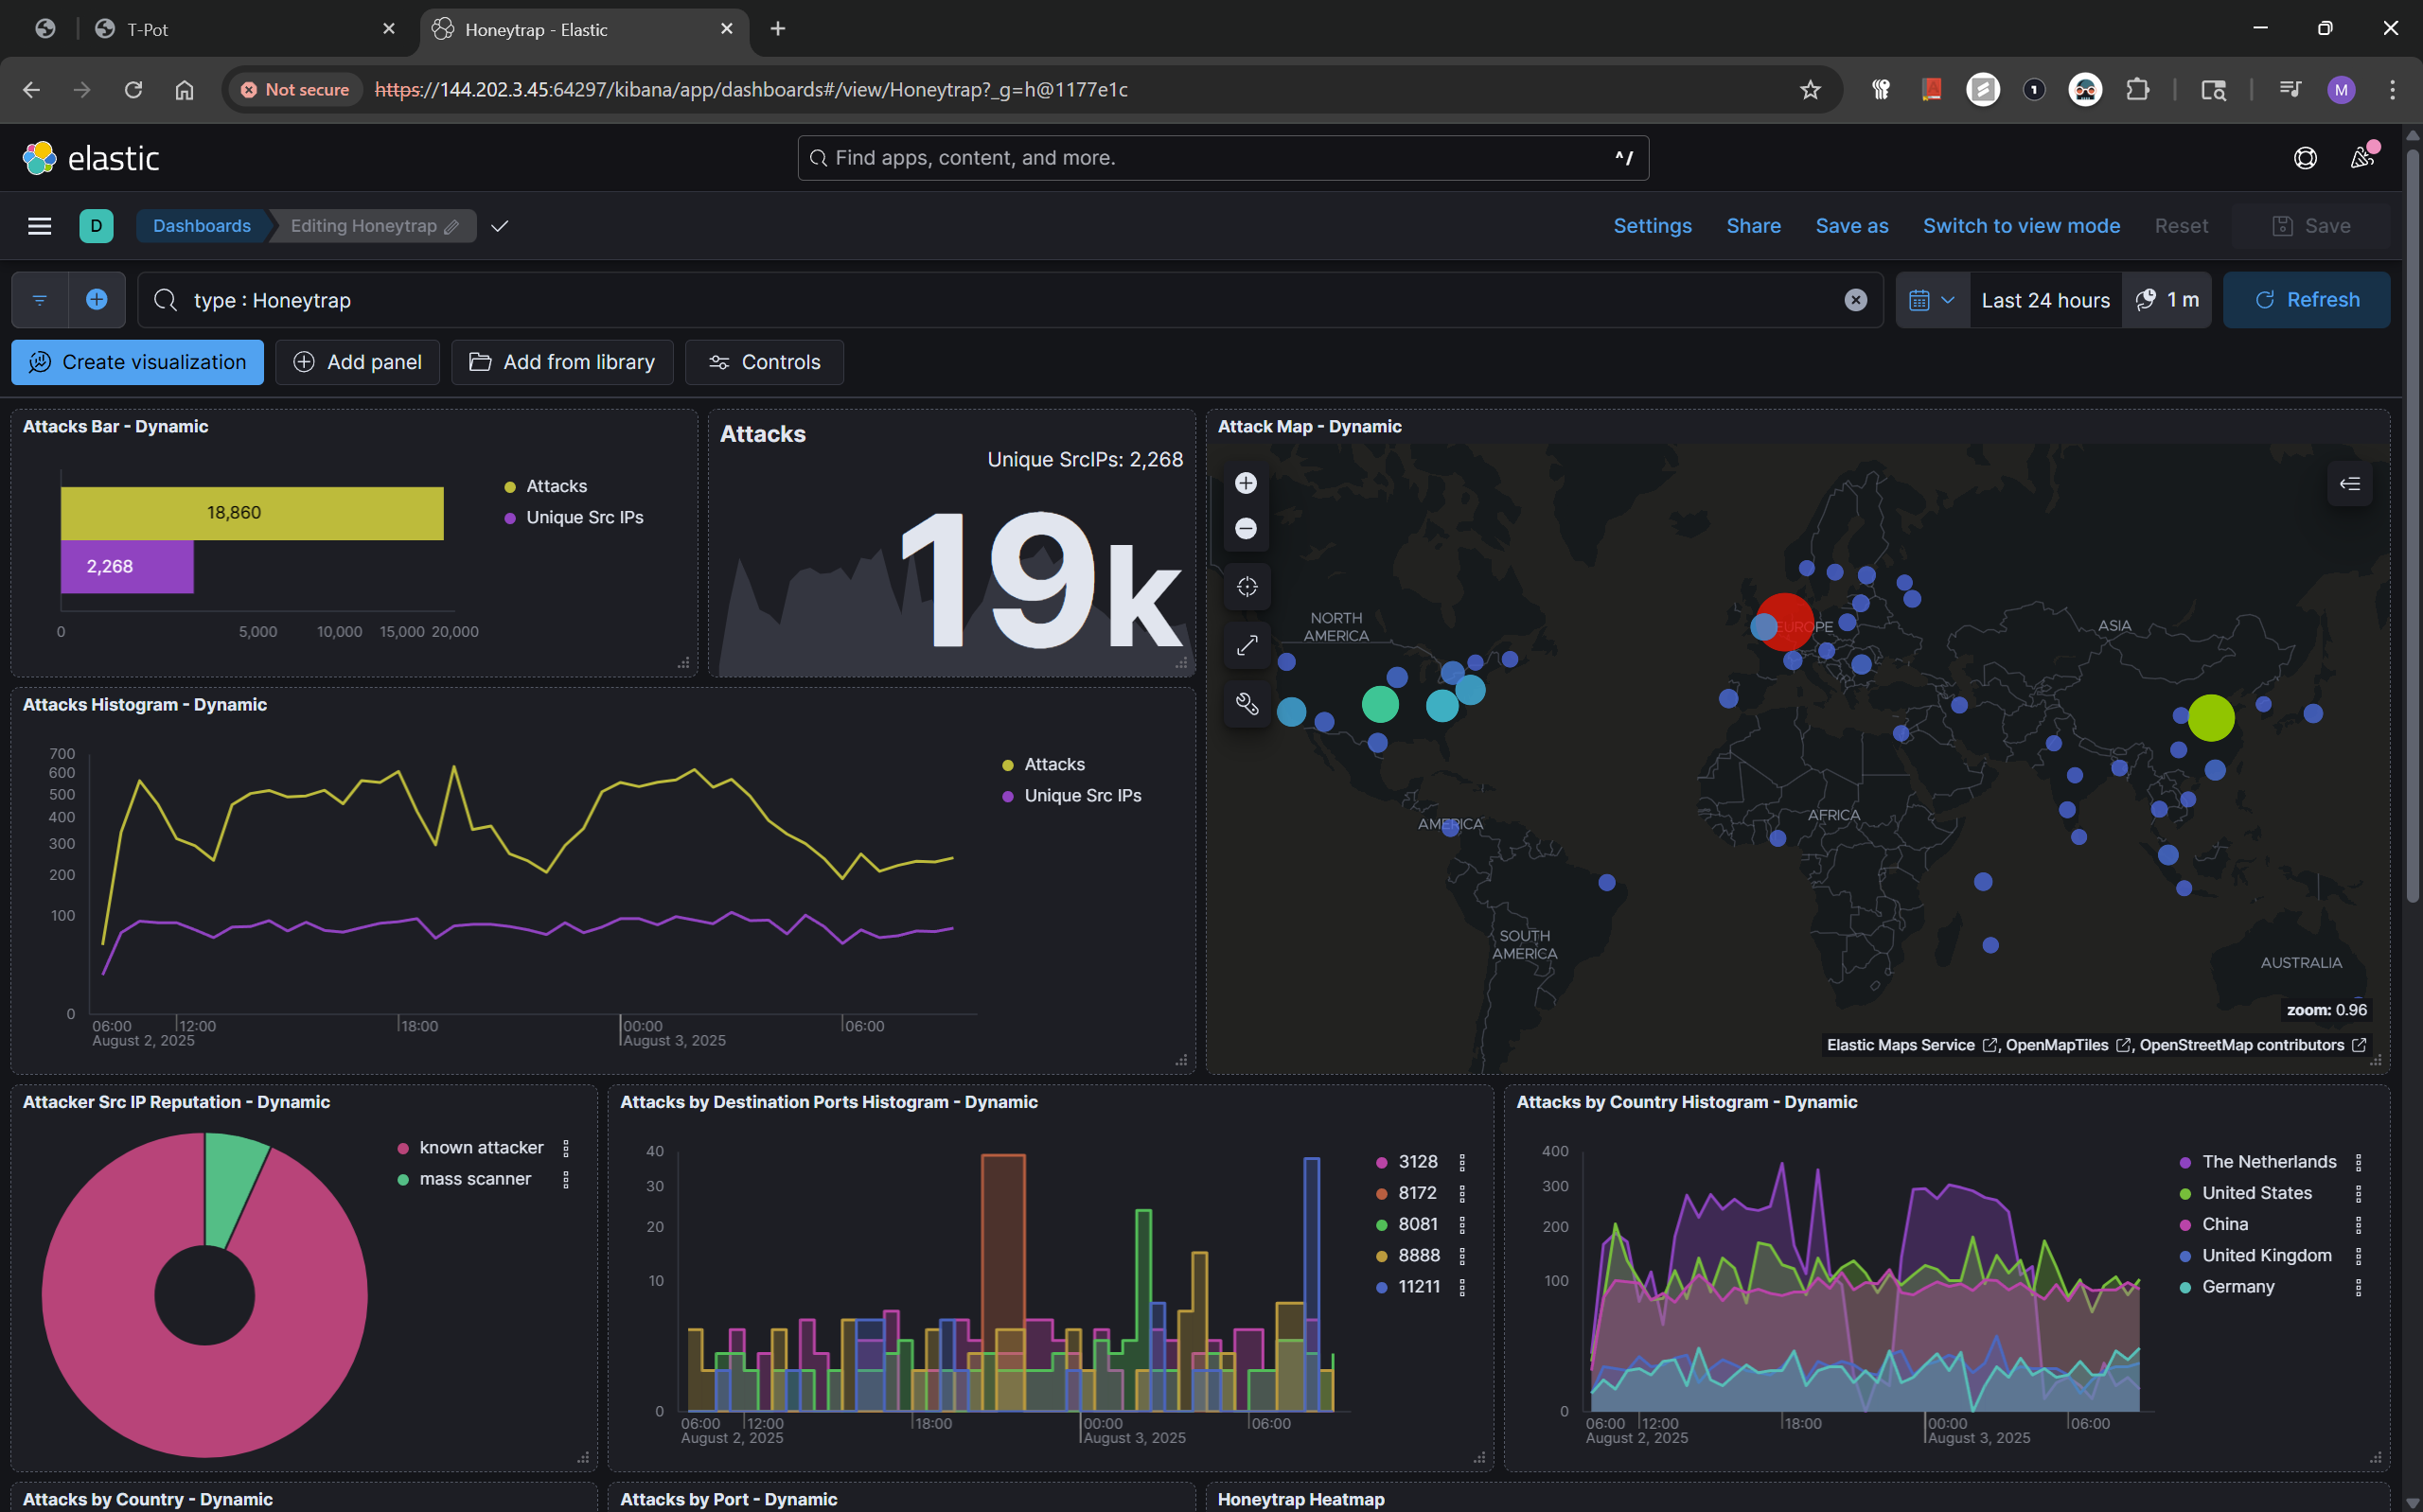
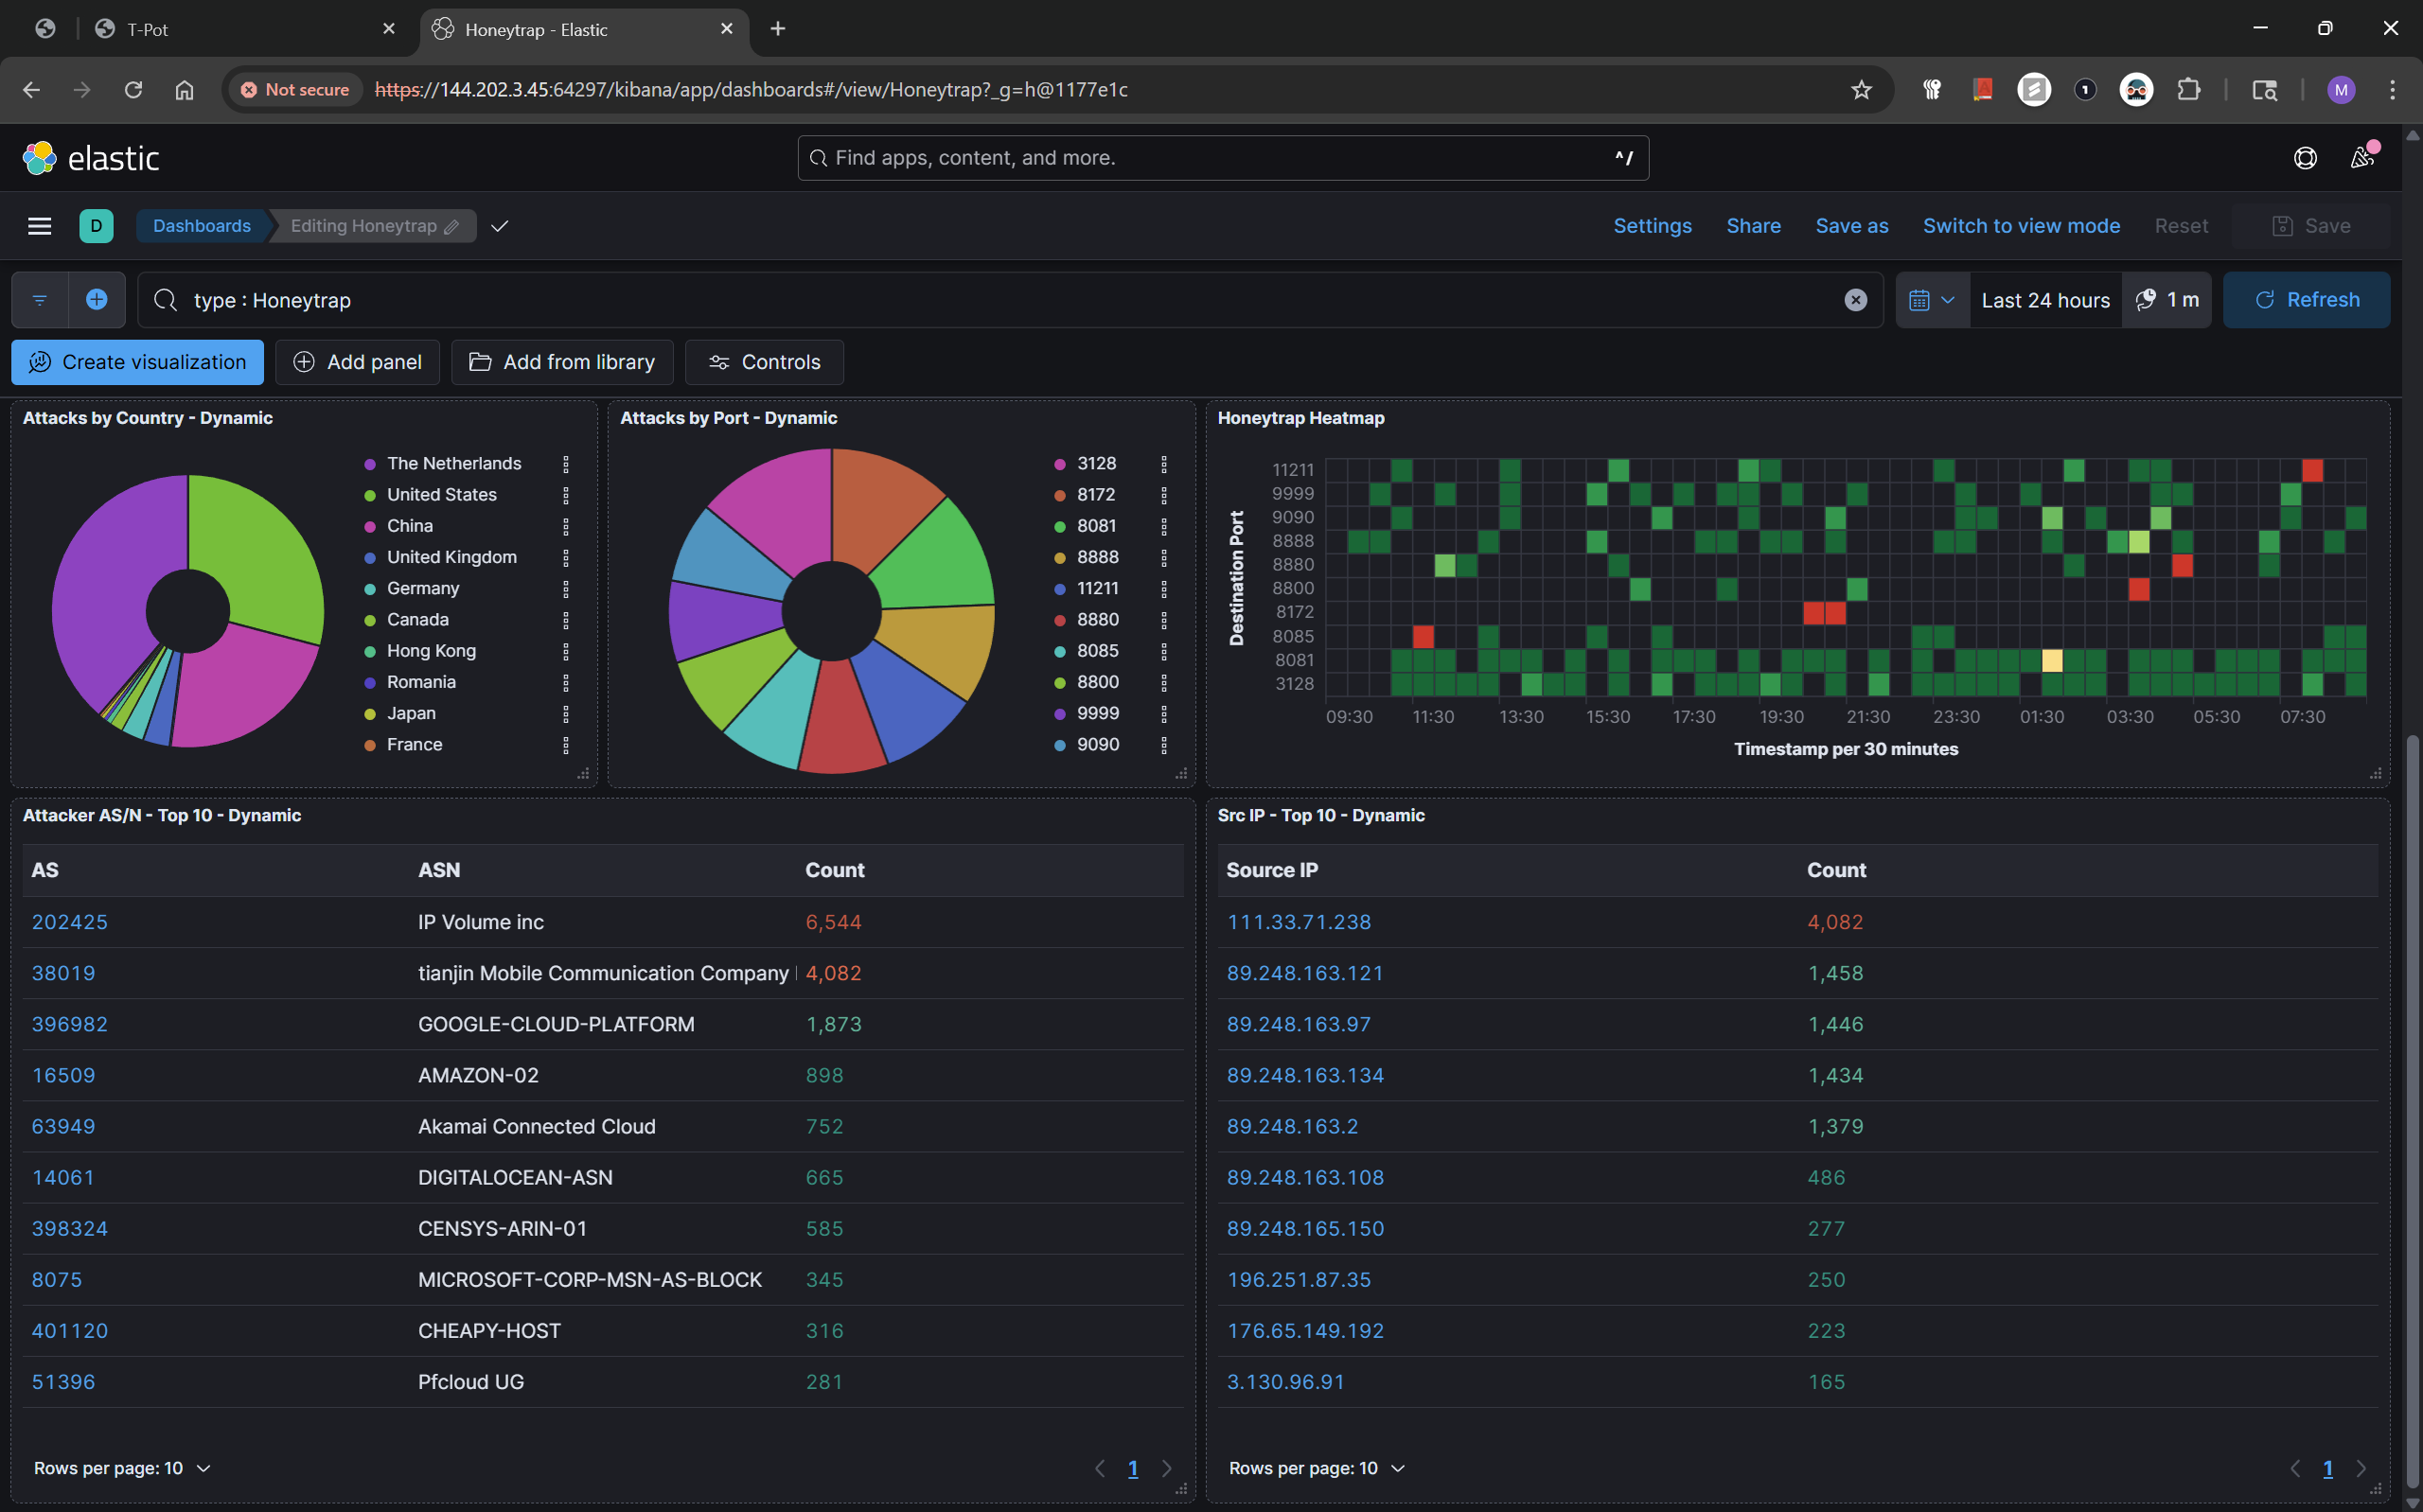
I expected the attacks to be mostly from mass scanners as I know people run them. From the metrics, it seems a lot of the attacks came from known attackers, Security never sleeps. See below;
T-Pot dashboard:
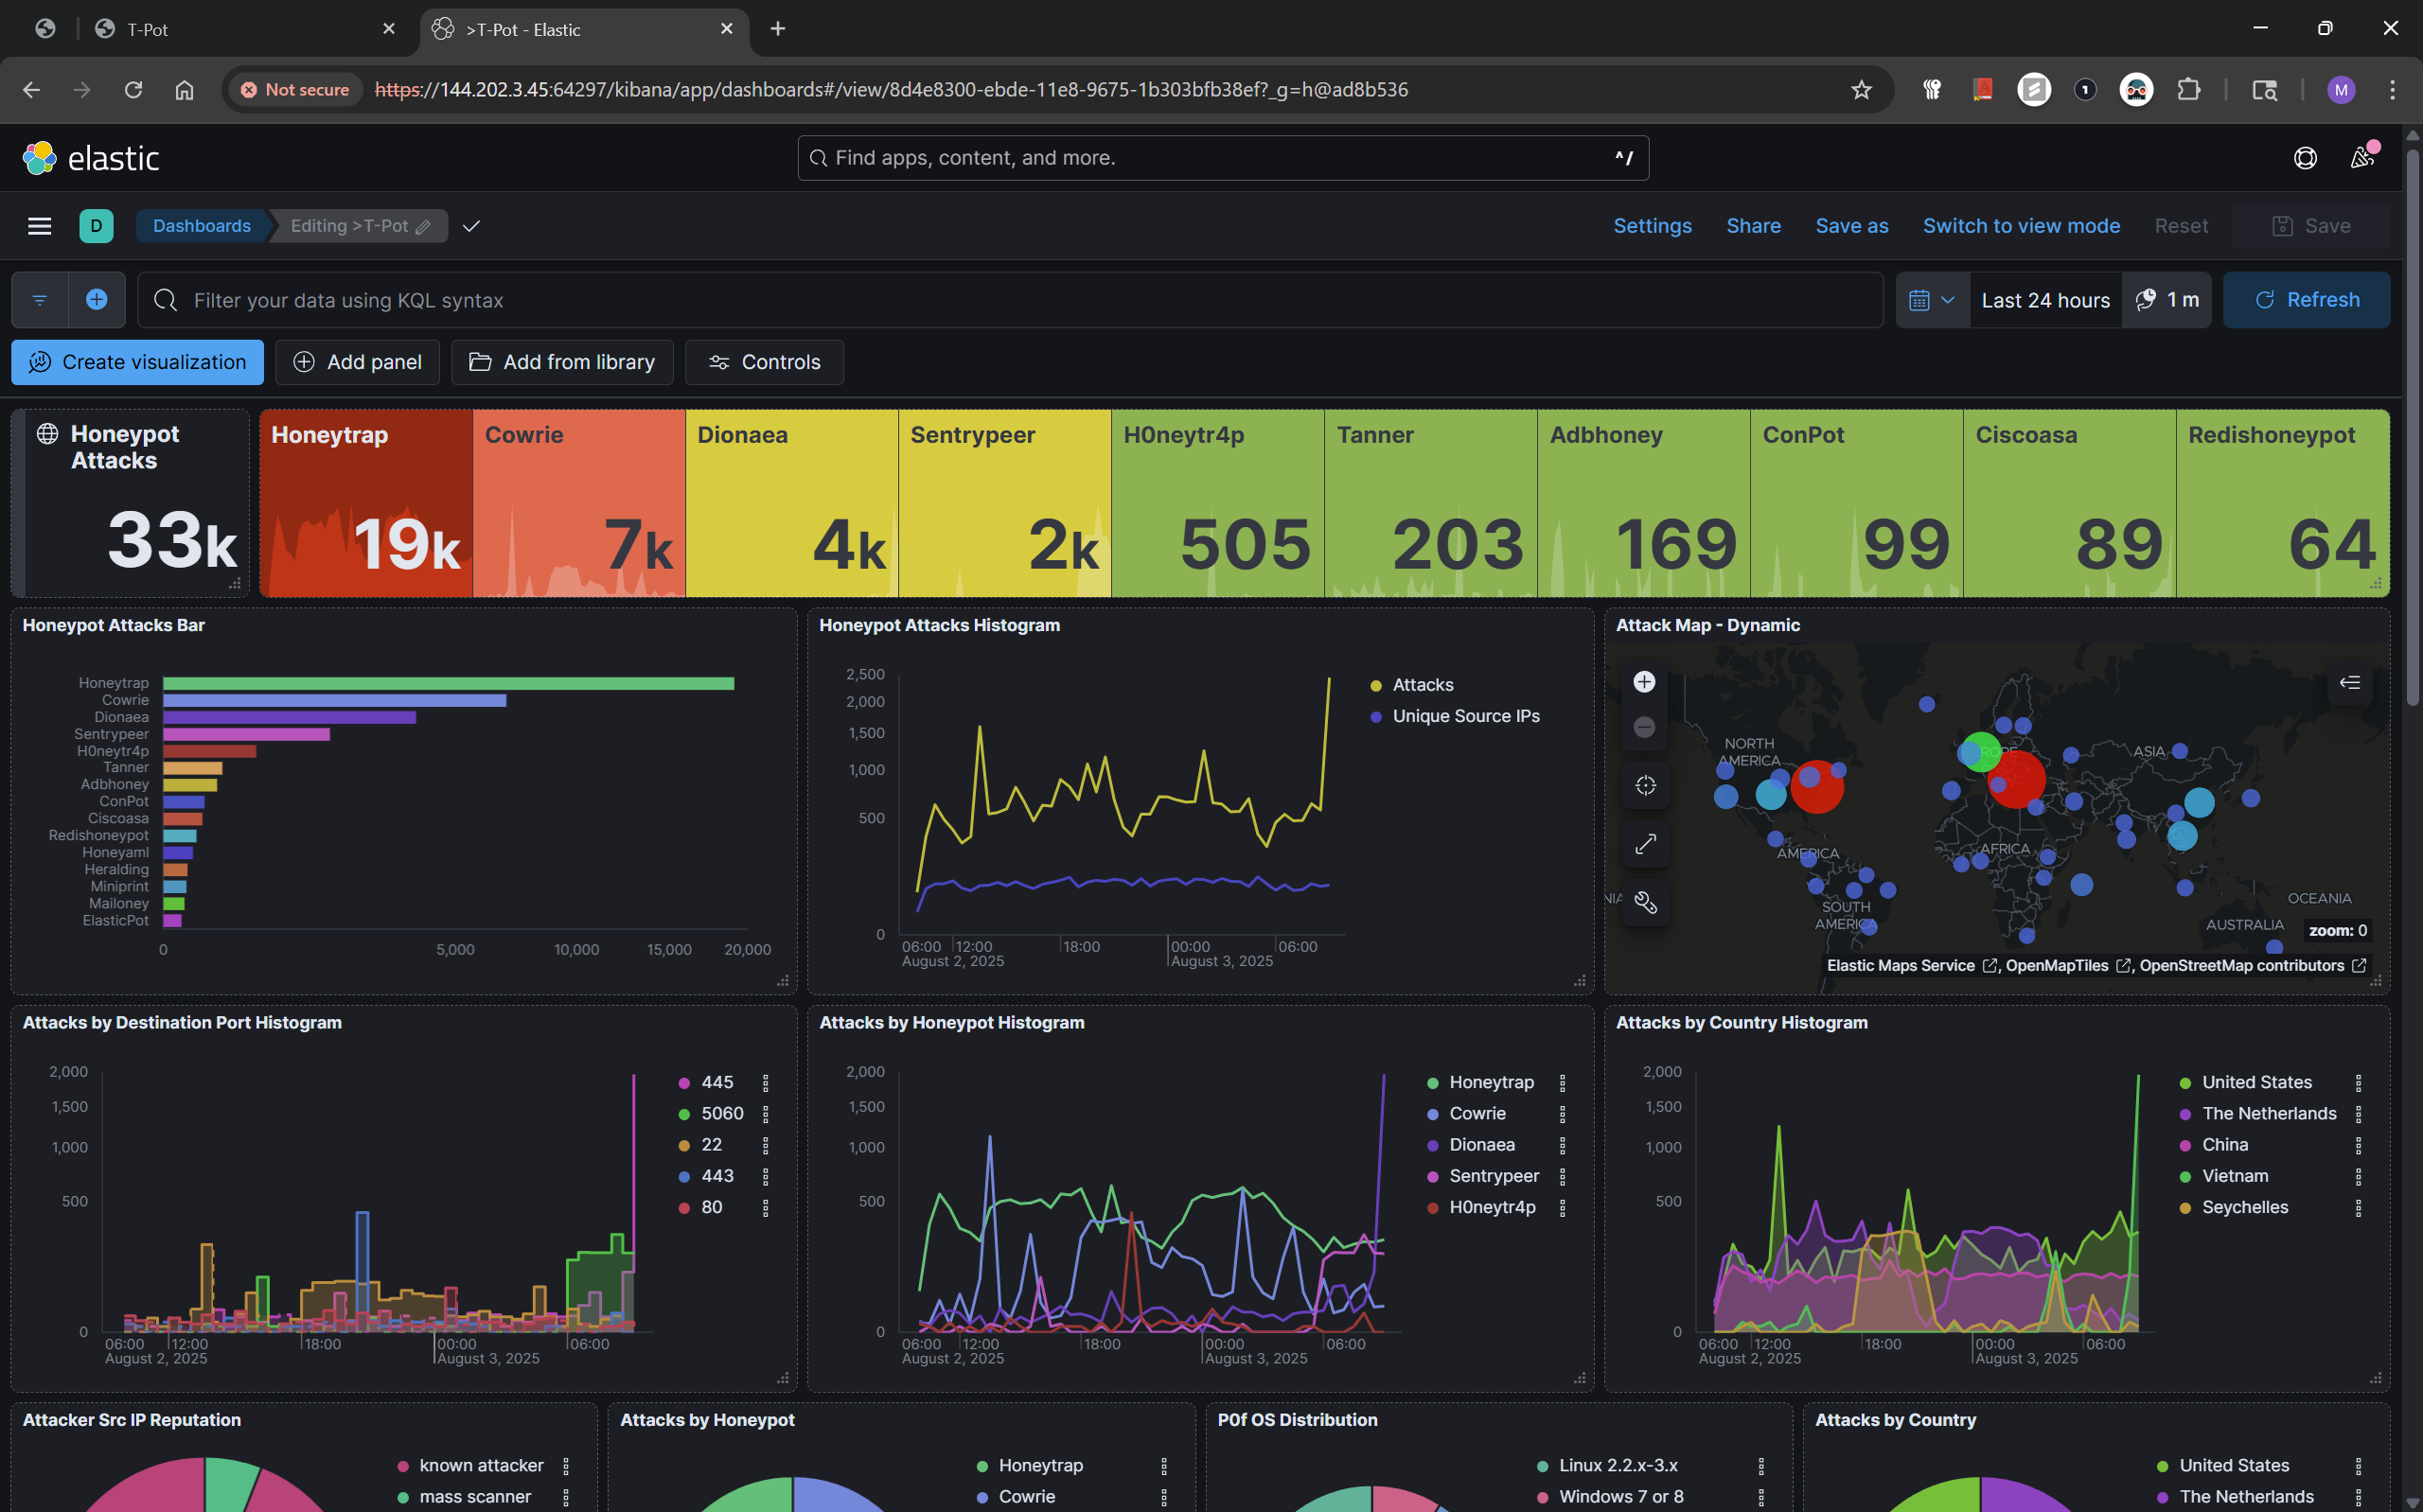
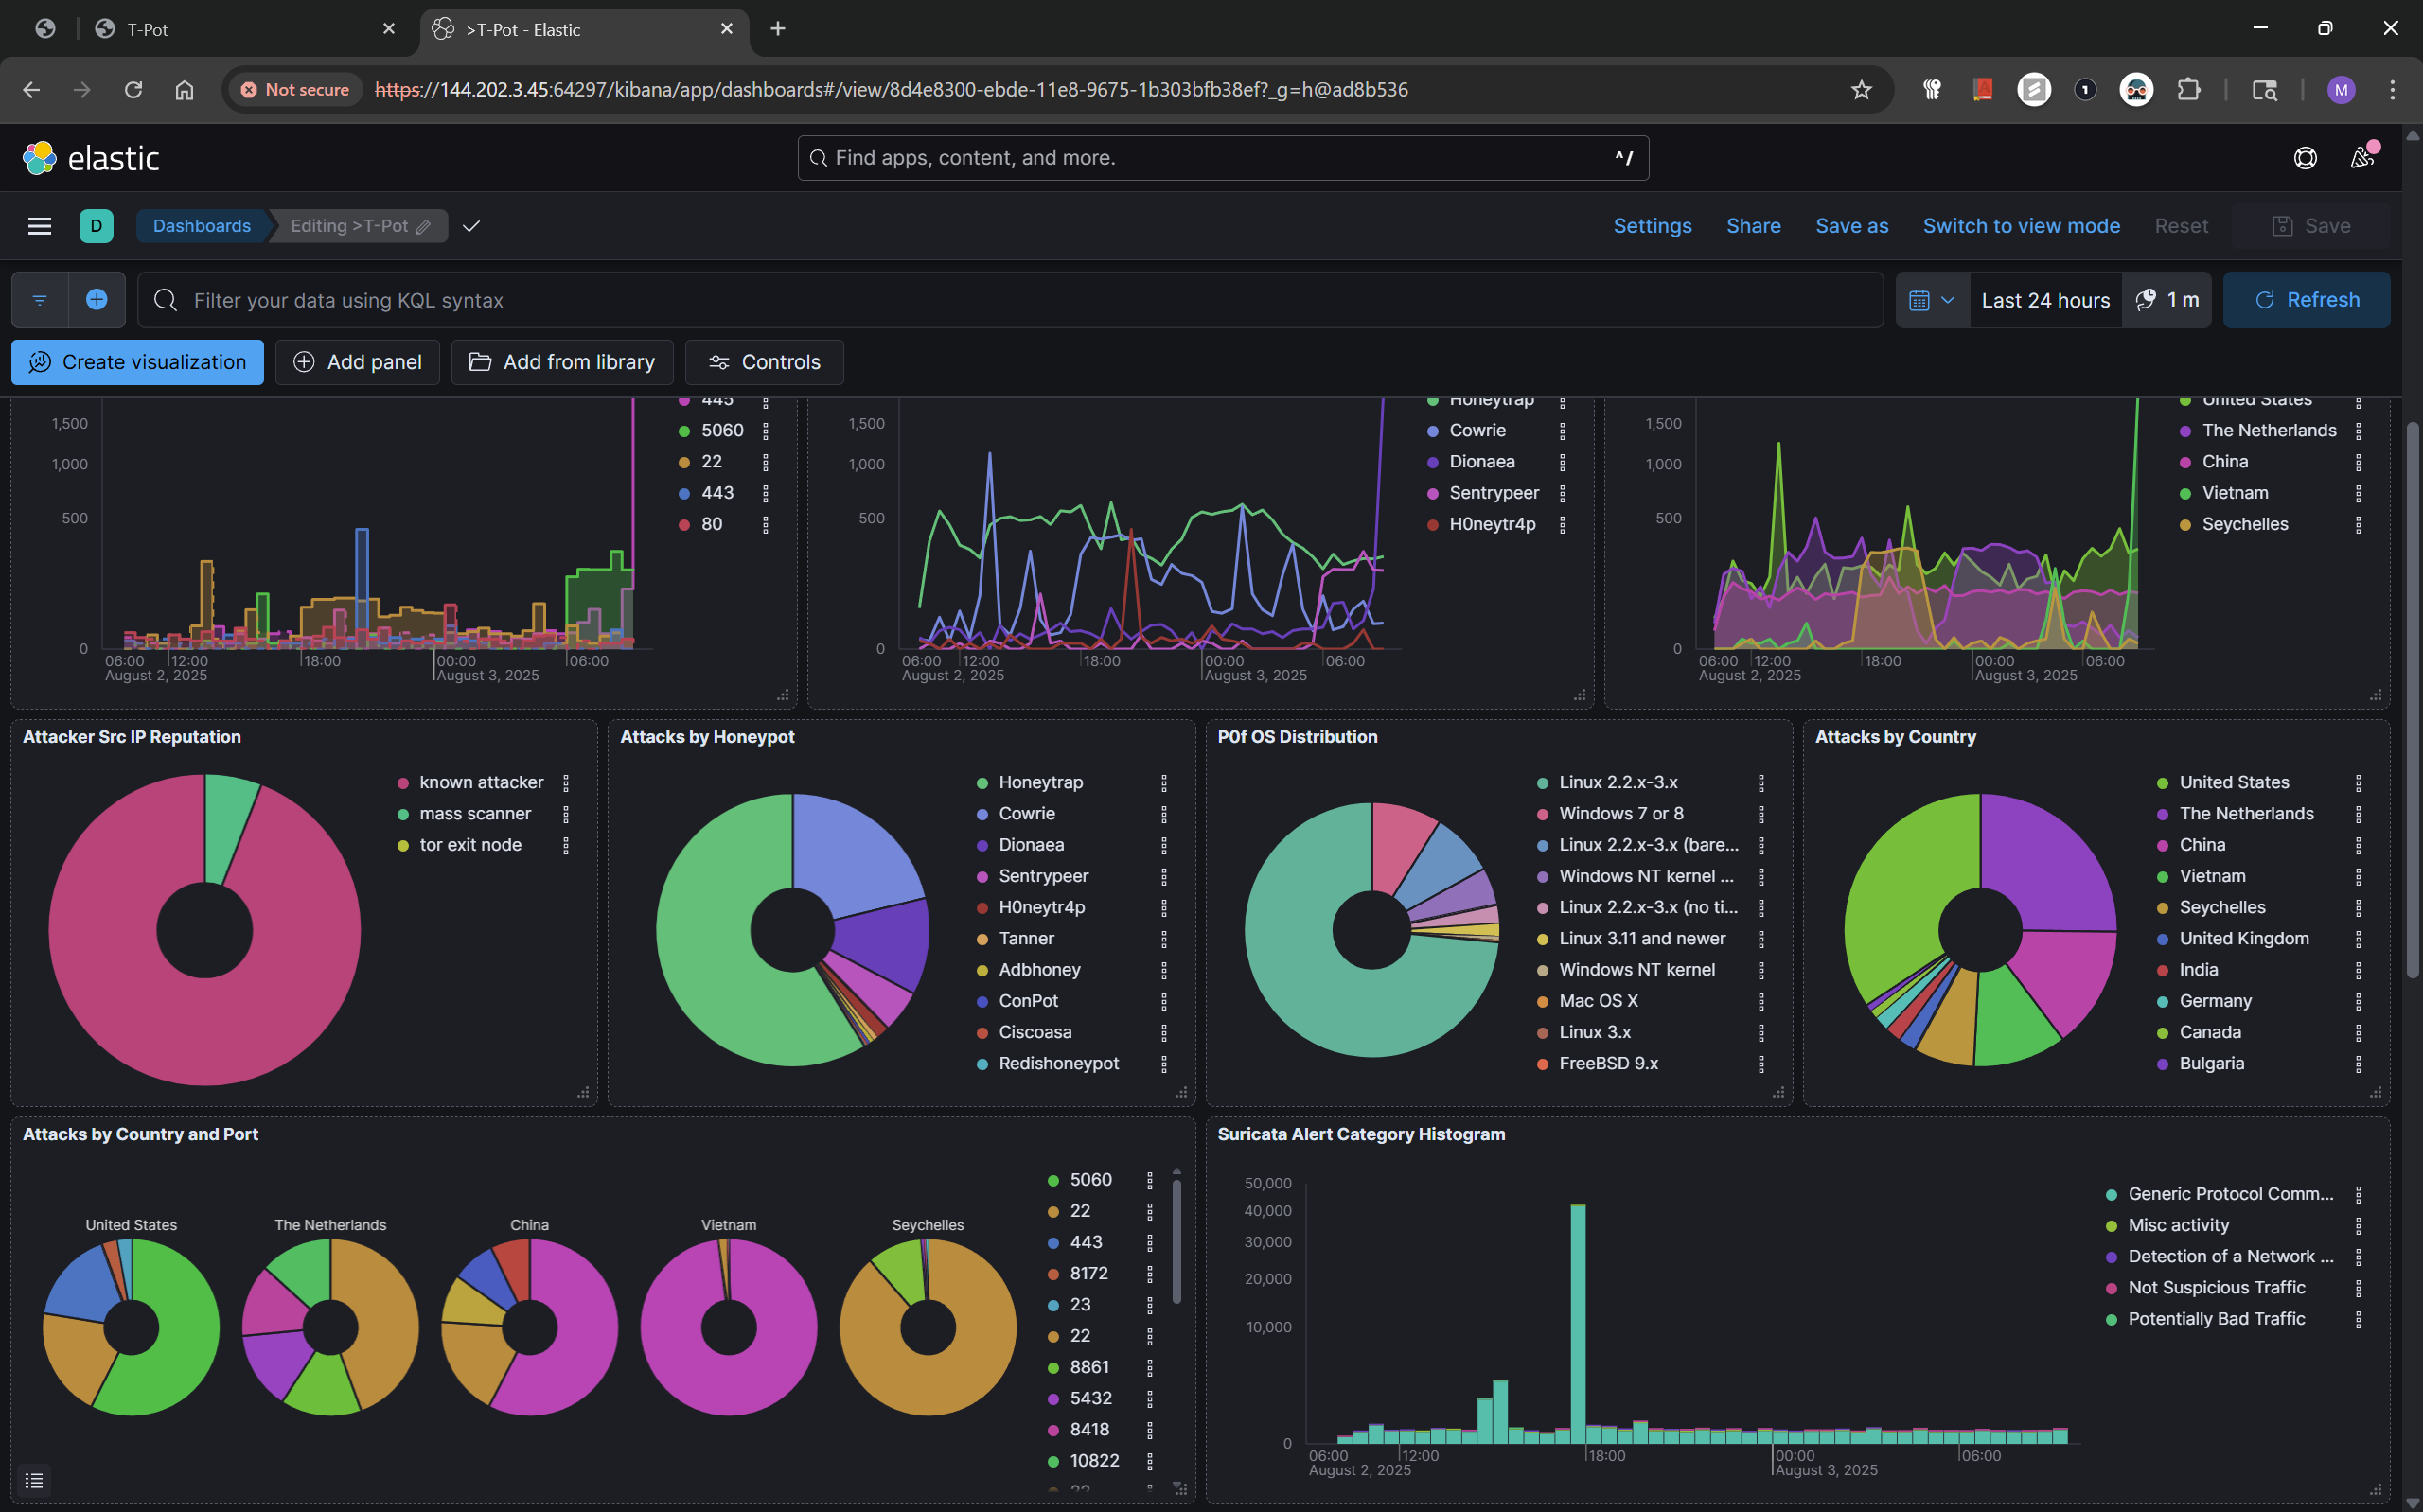
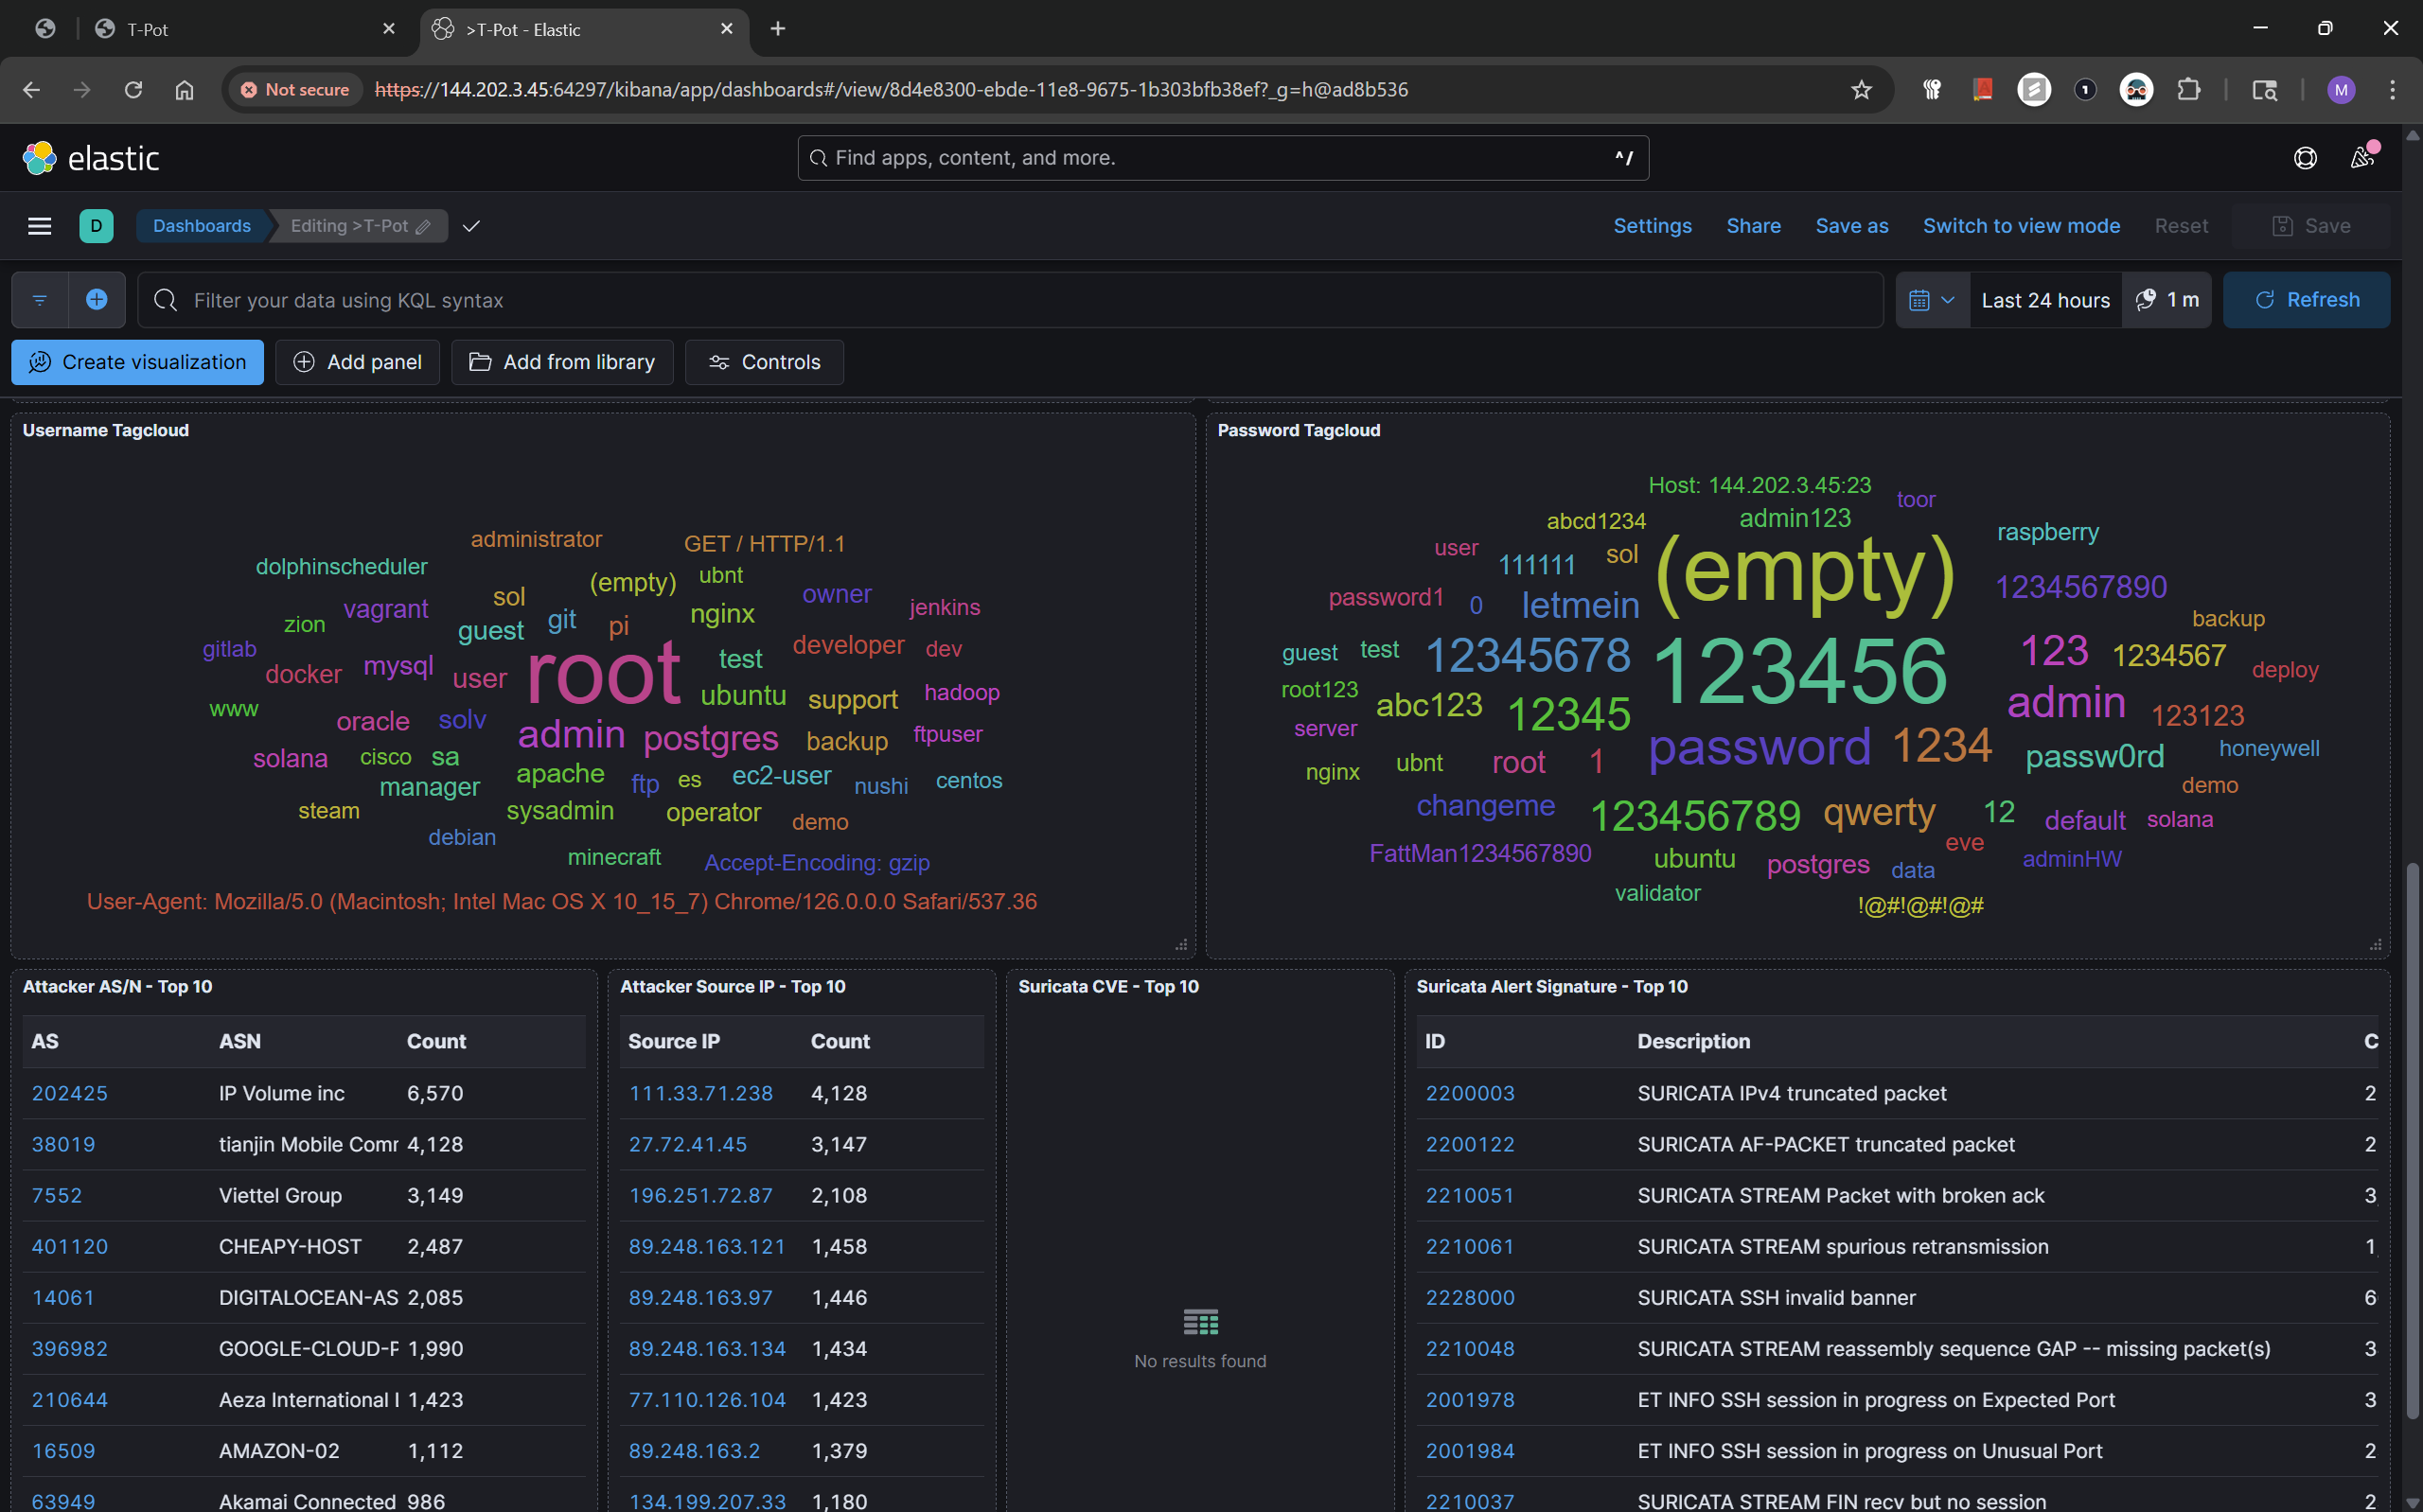
The T-Pot dashboard, also provides some great telemetry, it evens goes as far as showing the usernames and passwords used by attackers in trying to hack the servers.
Final Notes
I do not want to keep this blog long, but you can further dive into these alerts using Kibana Discover, you can run as many KQL queries as you want to triage threat actor activity. If you got this far, you have successfully deployed a honeypot, now you can apply it to whatever purpose you want. This was an insightful exercise, I now have real-time data on how attackers operate. Tools like T-Pot make it incredibly easy to observe threat actor behavior and improve blue team defense.
Thank You
Thanks for reading this blog post, you can contact me on Social Media if you have any questions.
